

User Guide
Dashboards
The Naver Cloud app includes the following built-in dashboards.
API Audit Dashboard
Calls the Naver Cloud Cloud Activity Tracer service API to monitor cloud activities in real time.
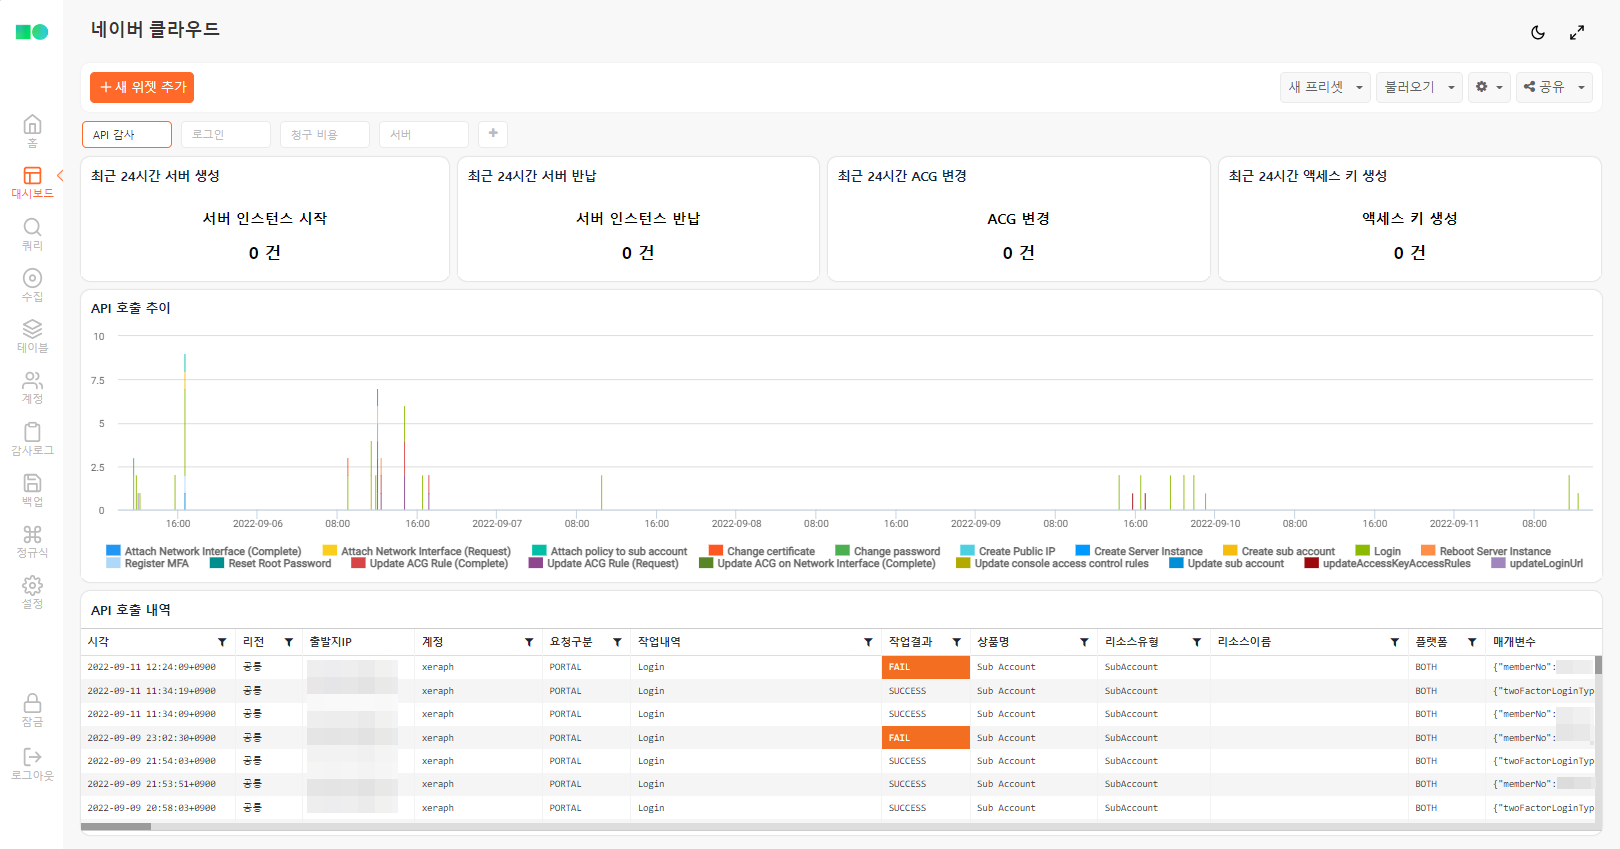
Server Creations in the Last 24 Hours
Displays the number of server instances newly created within the last 24 hours.
Server Terminations in the Last 24 Hours
Displays the number of server instances terminated within the last 24 hours. Be aware that unintended server terminations can lead to data destruction.
ACG Changes in the Last 24 Hours
Displays the number of ACG (Access Control Group) configuration changes within the last 24 hours. Unintended firewall policy changes can expose attack surfaces.
ncloud-activities duration=1d
| search action_name == "Update ACG*" and action_name == "*(Request)"
| stats count
Access Key Creations in the Last 24 Hours
Displays the number of access key creations within the last 24 hours. Access key issuance and permission scope should be minimized.
API Call Trends
Aggregates API call trends by type over the last week in 10-minute intervals, displayed as a stacked bar chart. You can verify whether unauthorized activities occurred during unusual time periods.
API Call History
Displays the Naver Cloud API call history. You can review details including parameters.
ncloud-activities duration=1w
| rename _time as Time, src_ip as SourceIP, user as Account, source_type as RequestType, action_name as Action, action_result_type as Result, product_name as Product, resource_type as ResourceType, resource_name as ResourceName, region_name as Region, platform_type as Platform, params as Parameters
| fields Time, Region, SourceIP, Account, RequestType, Action, Result, Product, ResourceType, ResourceName, Platform, Parameters
| limit 100
Login Dashboard
Visualizes Naver Cloud login anomalies for monitoring.
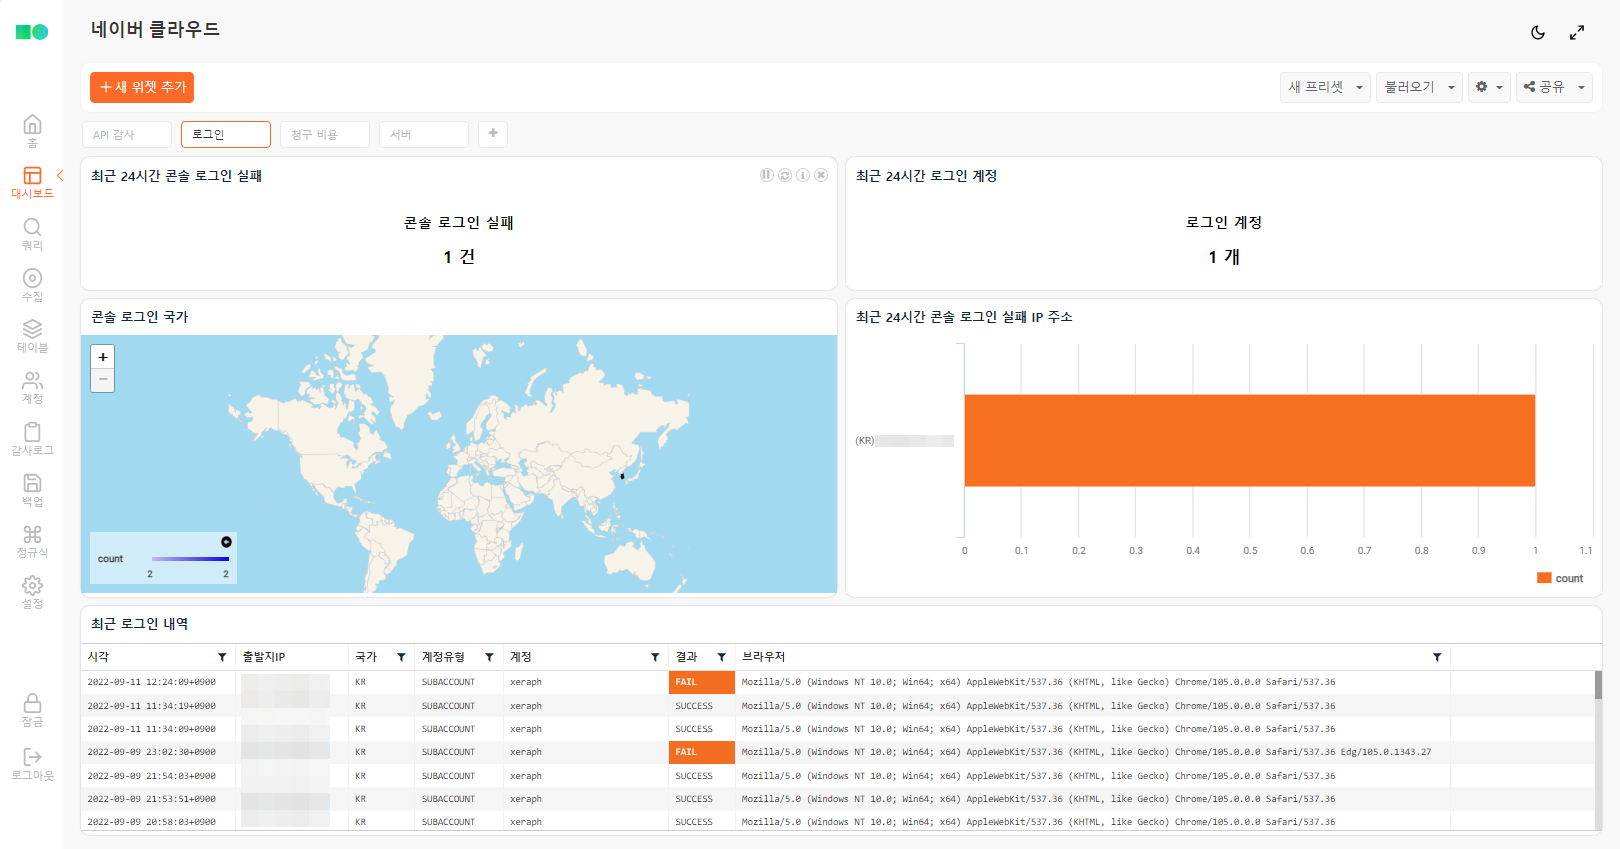
Console Login Failures in the Last 24 Hours
Displays the number of portal login failures within the last 24 hours.
ncloud-activities duration=1d
| search source_type == "PORTAL" and action_name == "Login" and action_result_type == "FAIL"
| stats count
Login Accounts in the Last 24 Hours
Displays the number of unique accounts that logged into the portal within the last 24 hours.
ncloud-activities duration=1d
| search source_type == "PORTAL" and action_name == "Login" and action_result_type == "SUCCESS"
| eval user = valueof(params, "userName")
| stats dc(user) as count
Console Login Countries
Displays the countries from which console logins occurred within the last 24 hours. You can intuitively identify whether there have been access attempts from unauthorized countries.
ncloud-activities duration=1d
| search source_type == "PORTAL" and action_name == "Login" and action_result_type == "SUCCESS"
| lookup geoip src_ip output country
| stats count by country
Failed Console Login IP Addresses in the Last 24 Hours
Displays the source IP addresses that failed to log into the console within the last 24 hours.
ncloud-activities duration=1d
| search source_type == "PORTAL" and action_name == "Login" and action_result_type == "FAIL"
| stats count by src_ip
| sort -count
| lookup geoip src_ip output country
| eval src = concat("(", country, ") ", string(src_ip))
Recent Login History
Displays recent login history. Since the browser agent is included, you can verify whether the access was from a known IP address and device.
ncloud-activities duration=1w
| search source_type == "PORTAL" and action_name == "Login"
| eval Account = valueof(params, "userName"), Browser = valueof(params, "userAgent"), AccountType = valueof(params, "userType")
| rename _time as Time, src_ip as SourceIP, action_result_type as Result | lookup geoip SourceIP output country as Country
| fields Time, SourceIP, Country, AccountType, Account, Result, Browser
| limit 100
Billing Dashboard
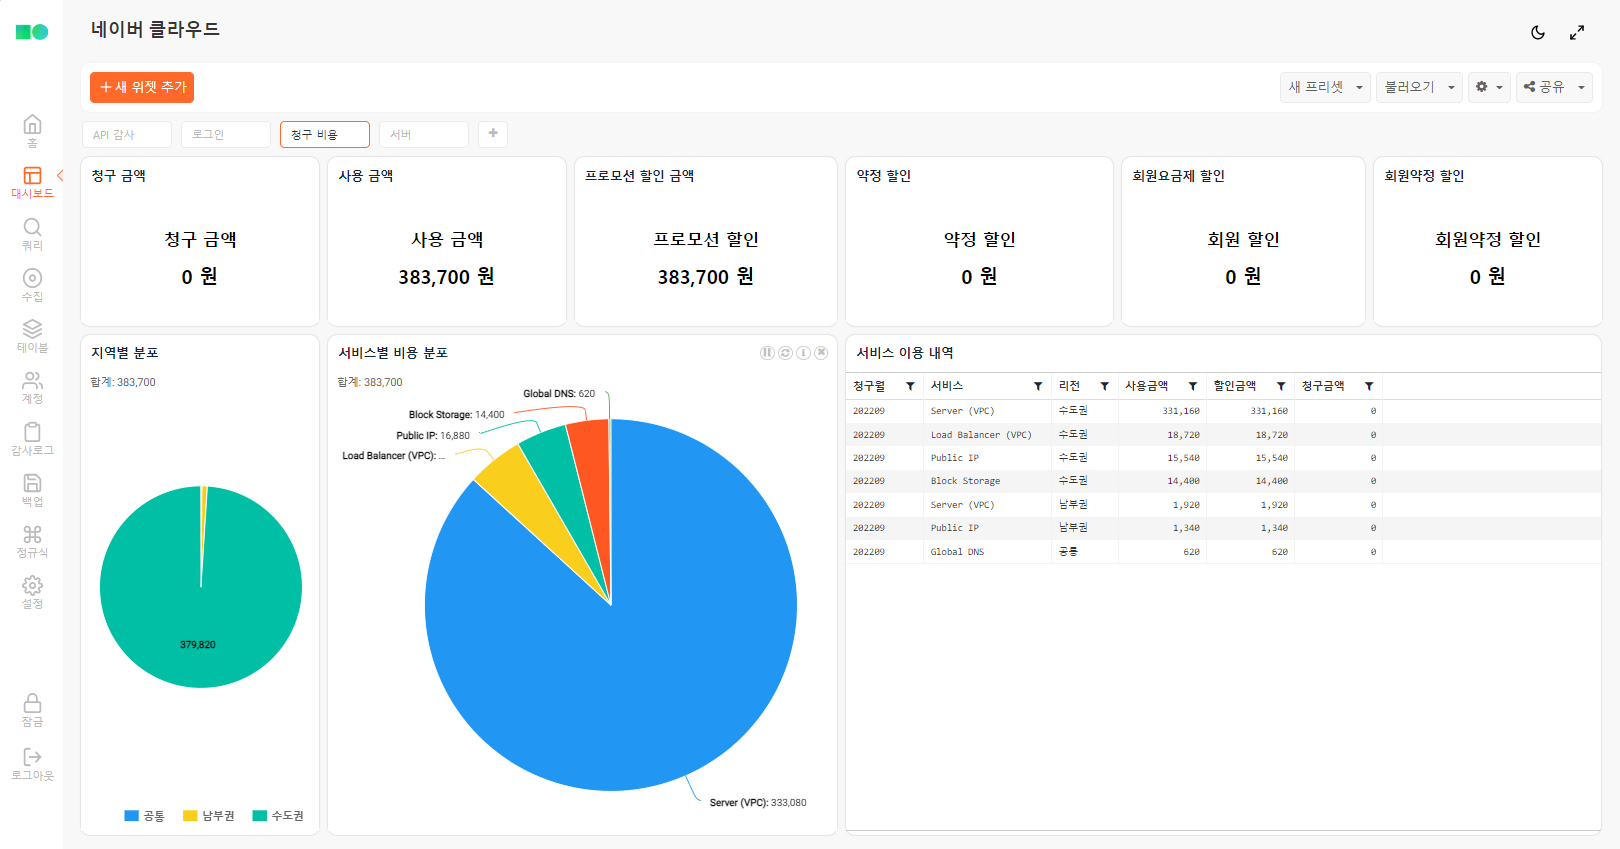
Billed Amount
Displays the amount to be billed for the current month. This is the amount after all discounts have been deducted from the usage amount.
Usage Amount
Displays the amount used for the current month. This is the amount calculated based on actual service usage regardless of discounts.
Promotion Discount
Displays the amount discounted through promotions such as credit usage.
Contract Discount
Displays the amount discounted through contracts.
Membership Plan Discount
Displays the amount discounted through the membership plan.
Membership Contract Discount
Displays the amount discounted through the membership contract plan.
ncloud-monthly-costs-by-contract
| stats sum(member_promise_discount) as member_promise_discount by month
Regional Distribution
Aggregates and displays usage amounts by region.
ncloud-monthly-costs-by-contract
| eval region = case(region == "KR", "Seoul Metropolitan", region == "KRS", "Southern", region == "COM", "Common", region)
| stats sum(used) as used by region
Cost Distribution by Service
Aggregates and displays usage amounts by product type.
ncloud-monthly-costs-by-contract
| stats sum(used) as used by product_name
| search used > 0
| sort -used
Service Usage Details
Aggregates and displays service usage amounts by product and region.
ncloud-monthly-costs-by-contract
| eval total_discount = promotion_discount + promise_discount + member_discount + member_promise_discount + etc_discount
| stats sum(used) as used, sum(total_discount) as total_discount by month, product_name, region
| search used > 0
| eval demand_cost = used - total_discount
| eval region = case(region == "KR", "Seoul Metropolitan", region == "KRS", "Southern", region == "COM", "Common", region)
| rename month as BillingMonth, product_name as Service, region as Region, used as UsageAmount, total_discount as DiscountAmount, demand_cost as BilledAmount
| fields BillingMonth, Service, Region, UsageAmount, DiscountAmount, BilledAmount
| sort -UsageAmount
Server Dashboard
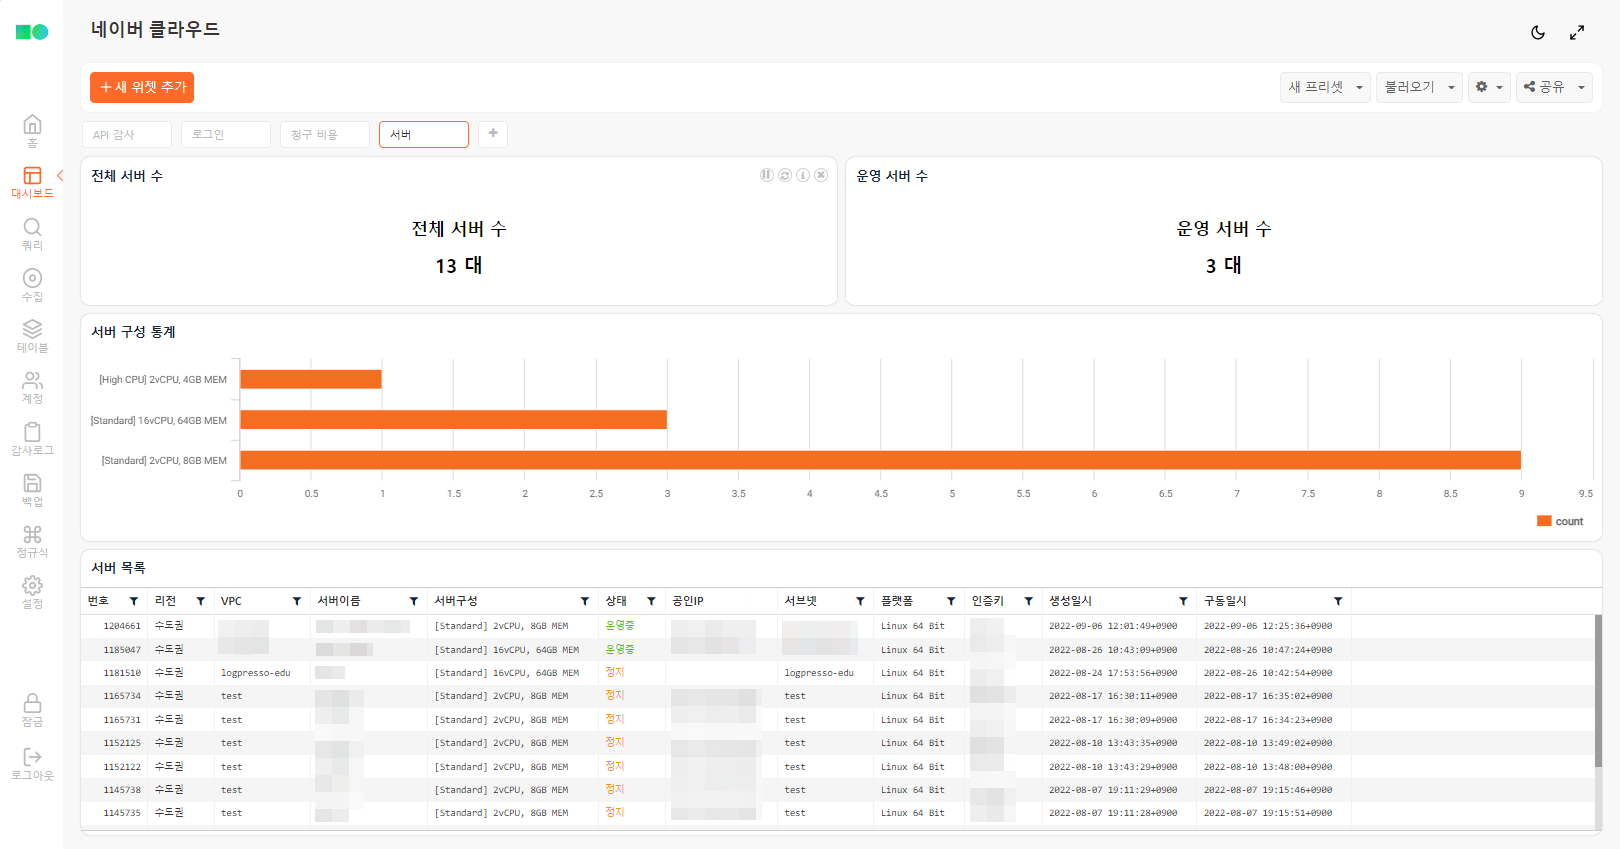
Total Server Count
Displays the number of server instances across all regions.
Running Server Count
Displays the number of currently running server instances across all regions.
Server Configuration Statistics
Aggregates and displays the number of server instances by configuration (CPU, memory, etc.) across all regions.
ncloud-servers
| eval memGB = floor(memory_size / 1024 / 1024 / 1024)
| eval type = concat("[", server_type_name, "] ", cpu_count, "vCPU, ", memGB, "GB MEM")
| stats count by type
Server List
Displays the list of server instances across all regions.
ncloud-servers
| join vpc_no [ ncloud-vpcs | fields vpc_no, vpc_name ]
| join subnet_no [ ncloud-subnets | fields subnet_no, subnet_name ]
| eval memGB = floor(memory_size / 1024 / 1024 / 1024)
| eval ServerConfig = concat("[", server_type_name, "] ", cpu_count, "vCPU, ", memGB, "GB MEM")
| eval Status = case(status == "RUN", "Running", status == "NSTOP", "Stopped", status)
| eval region = case(region == "KR", "Seoul Metropolitan", region == "KRS", "Southern", region)
| rename region as Region, no as No, name as ServerName, public_ip as PublicIP, platform_type_name as Platform, login_key_name as AuthKey, created as CreatedAt, uptime as StartedAt, vpc_name as VPC, subnet_name as Subnet
| fields No, Region, VPC, ServerName, ServerConfig, Status, PublicIP, Subnet, Platform, AuthKey, CreatedAt, StartedAt