

User Guide
Previously, heap dumps could not be analyzed immediately after generation. Users had to export the heap dump file and analyze it using Eclipse Memory Analyzer. However, heap dump files are typically very large—at least several gigabytes—making them time-consuming to export and difficult to get approval for, especially in on-premises environments.
The Memory Analyzer app was developed to solve this problem. With a binary size of only ~2MB, it enables efficient analysis of heap dumps without external tools. This guide explains how to analyze a heap dump after a GC failure caused by memory exhaustion.
The examples in this guide are based on a real memory leak issue encountered during the development of issue SNR3067.
Building the Index
Since HPROF files are often tens of gigabytes in size, analysis without indexing is not practical. You can generate an index with the following query:
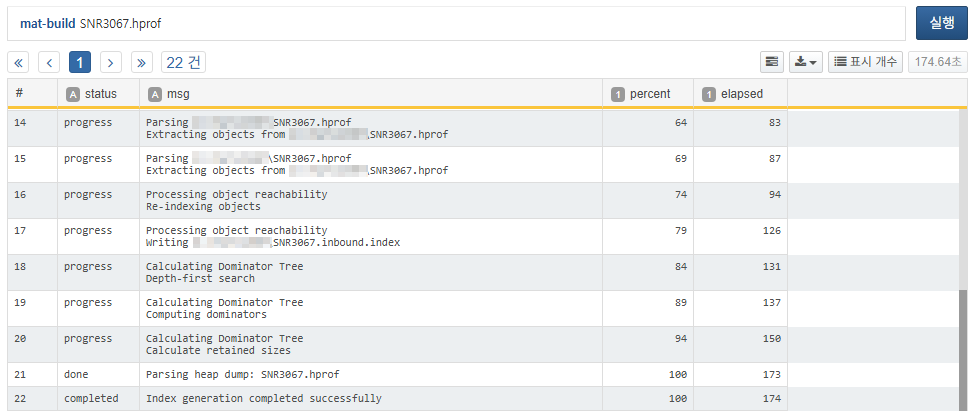
Once the progress reaches 100% and you see Index generation completed successfully, the index has been built successfully. The following index files will be created in the same directory as the HPROF file:
| File Extension | Type | Description |
|---|---|---|
| SNR3067.idx.index | Object ID to Address | Object ID to memory address mapping |
| SNR3067.o2hprof.index | Object to HPROF Position | Object ID to position in HPROF file |
| SNR3067.o2c.index | Object to Class | Object ID to class ID mapping |
| SNR3067.a2s.index | Array to Size | Array object to size mapping |
| SNR3067.o2ret.index | Object to Retained Heap | Object ID to retained heap size |
| SNR3067.domIn.index | Dominator Inbound | Dominator relationship (child to parent) |
| SNR3067.domOut.index | Dominator Outbound | Dominator relationship (parent to children) |
| SNR3067.i2sv2.index | Index to String Value v2 | Cached string values of java.lang.String objects |
| SNR3067.inbound.index | Reference relationship (referent to referrers) | |
| SNR3067.outbound.index | Reference relationship (referrer to referents) | |
| SNR3067.index | Overall snapshot metadata: class definitions, object count, heap size, etc. | |
| SNR3067.threads | Thread information |
Analyzing Top Memory Retainers
In memory leak scenarios, a few objects typically retain most of the heap. Use the mat-dominators command to quickly identify these top retainers:
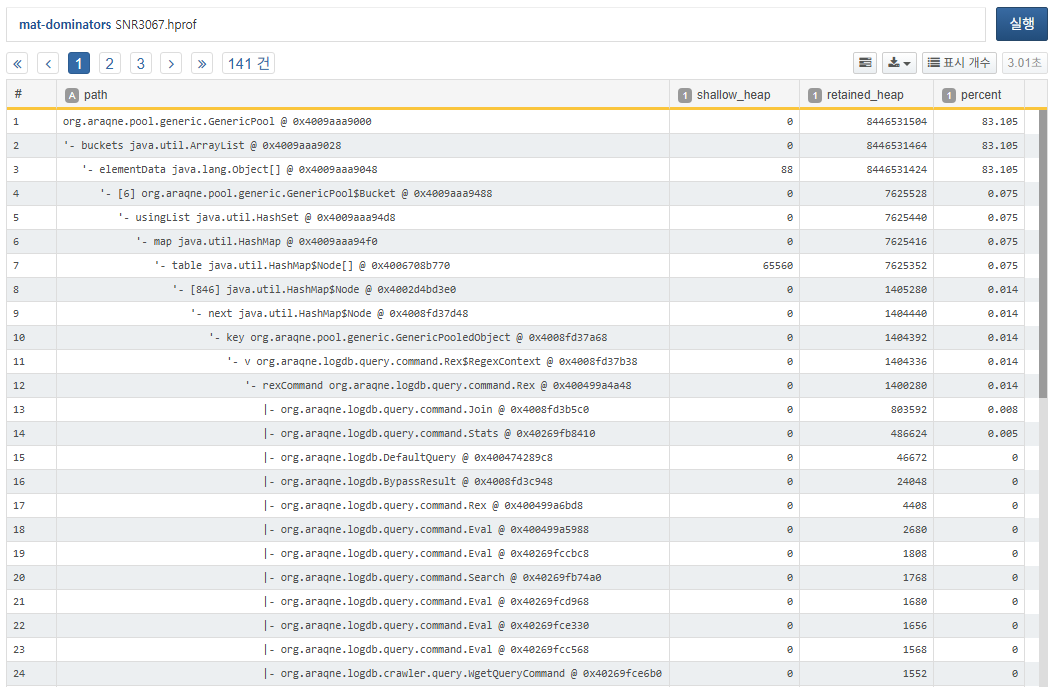
The result shows that org.araqne.pool.generic.GenericPool @ 0x4009aaa9000 retains a significant 83.105% of the heap. By expanding the dominator tree, you can observe that Rex$RegexContext likely occupies a large portion of the pool. Note that the tree shows representative cases only. Even if Rex$RegexContext shows just 0.014%, it could still be responsible for massive memory retention. You can confirm this via a histogram analysis.
Histogram Analysis
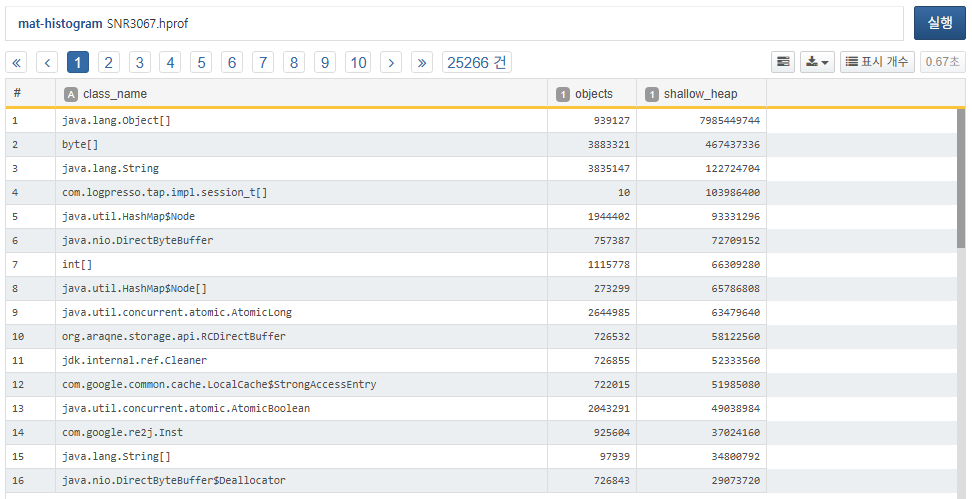
While org.araqne.logdb.query.command.Rex$RegexContext ranked 34th with 96,606 instances (not visible in the screenshot), note the 14th-ranked com.google.re2j.Inst. Typically, internal JDK classes such as java.lang.Object[] or byte[] can be ignored. Focus instead on app-specific classes like com.logpresso.tap.impl.session_t[] or org.araqne.storage.api.RCDirectBuffer. Since session_t and RCDirectBuffer showed similar retention in previous versions, the key suspect in this case is com.google.re2j.Inst.
GC Path Analysis by Class
Use the mat-class2gc command to sample (default 10) instances of a given class and visualize what objects are holding references to them.
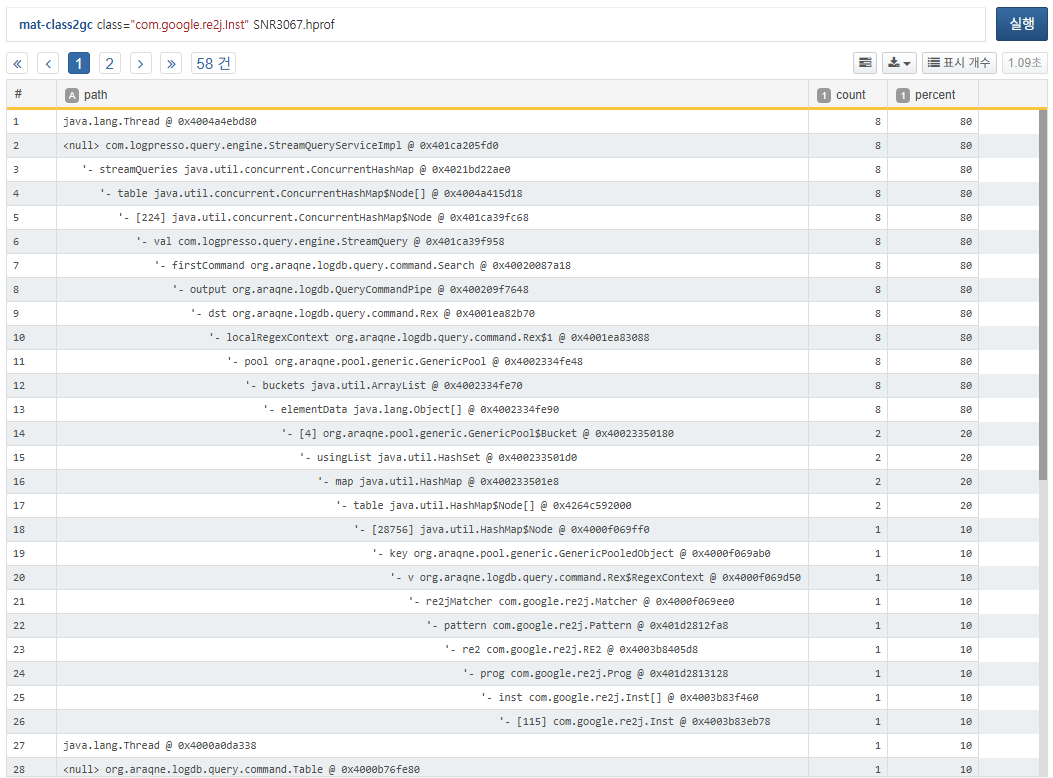
The analysis shows that com.google.re2j.Inst instances are referenced by the object pool of the rex query command (org.araqne.logdb.query.command.Rex) used in stream queries.
GC Path Analysis by Object
To inspect a specific object in memory, use mat-path2gc to trace its reference path.
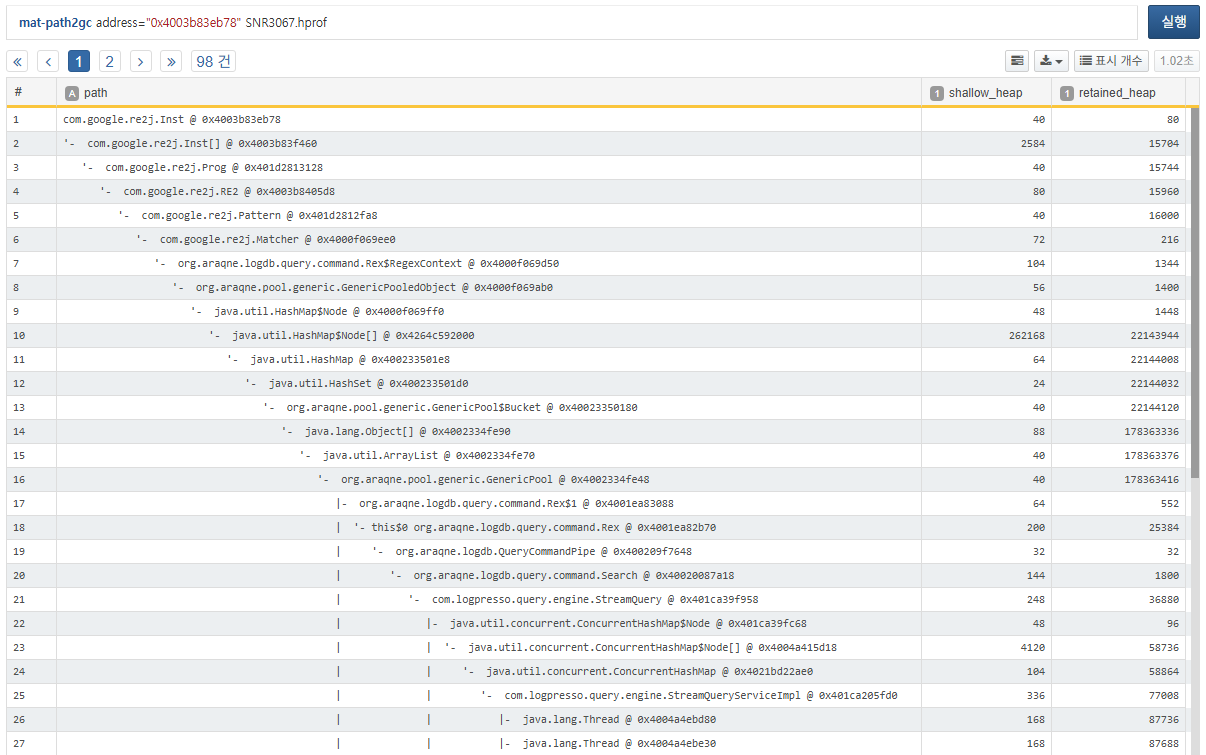
The reference path traces from the specified address up to its retainers. In the GC path tree, this appears to move downward, but logically it traces upwards to parent objects. The segment with the spike in retained_heap is usually the root cause of the leak.
Inspecting Object Attributes
To identify exactly which rex query caused the issue, inspect the fields of a specific object:
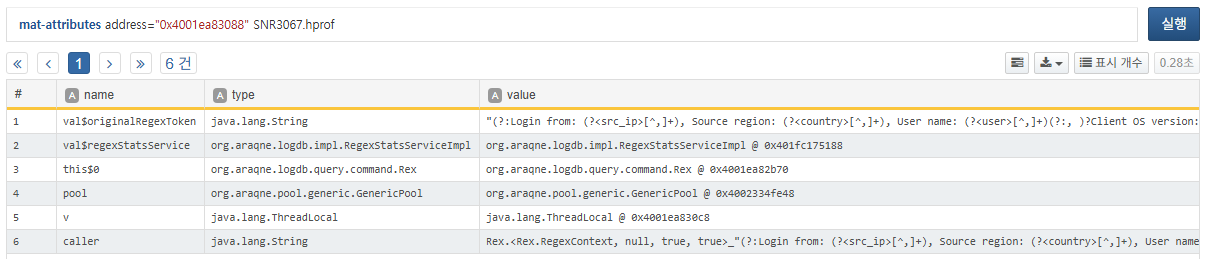
You can now clearly identify the problematic regex pattern used in the rex query:
(?:Login from: (?<src_ip>[^,]+), Source region: (?<country>[^,]+), User name: (?<user>[^,]+)(?:, )?
Client OS version: (?<client_os>[^\"]+), Reason: (?<reason>.*?), Auth type: (?<auth_type>.*)\.\")
|(?:Login from: (?<src_ip>[^,]+), Source region: (?<country>[^,]+), User name: (?<user>[^,]+),
Auth type: (?<auth_type>[^,]+).Client OS version: (?<client_os>[^\"]+))
Follow-up Actions
Once you've analyzed the heap as shown above, please report your findings through the Logpresso support portal for further diagnosis or patch assistance. If you're having difficulty extracting data onsite, the Logpresso technical support team is available to assist.