

User Guide
Overview
From Logpresso's perspective, NAC solutions serve the following purposes:
- Identifying targets for threat detection scenarios
- When building an integrated information security platform, it is common to find that asset information is not well maintained. Network segmentation and asset type identification are critical when creating threat detection scenarios. For example, while outbound internet access is typical for office PCs, it is uncommon for servers. Genian NAC provides extensive information related to each IP, including hardware, operating systems, and vulnerability assessment details, enabling better detection scenarios.
- Providing asset information upon threat detection
- Even when individual security systems such as IPS, WAF, or APT solutions detect and block attack attempts, detailed information about internal assets must be reviewed to determine the appropriate follow-up actions. Depending on the operating system version or software configuration, a particular attack may have no impact at all. For example, even if an internal host is found attempting to connect to a C&C server, a hasty response could lead to service disruptions. Asset information should be checked first to determine whether there is a risk of impacting business continuity.
- Maintaining security policies and responding to threats
- It is common to see operational procedures where IP and device registration is requested only after all tasks required for security policy compliance have been completed, such as installing mandatory agents like antivirus, and the security team verifies and processes the request. Network quarantine can be automatically lifted as tasks are completed. On the other hand, when the security team decides to quarantine a network upon threat detection, Logpresso can execute blocking actions across all individual security systems, including NAC, without having to directly access NAC to configure the network quarantine.
The core concepts of Genian NAC are "nodes" and "node groups." A node manages all information related to an IP, and a node group manages nodes that match specific conditions. The same node can belong to multiple node groups.
Controls such as network access authorization or quarantine are performed by "enforcement policies." Enforcement policies are applied in the configured order and support quarantine by allowing only specified types of network access for specific node groups based on network ranges, services (such as DNS), and time.
Logpresso uses an approach of assigning "tags" to nodes, associating these tags with node groups, and then executing quarantine enforcement policies. Since tags can be assigned for a limited duration, nodes can be quarantined from the network for a short period and automatically released.
Dashboards
This section describes the Genian NAC dashboard configuration.
General Status
The alert box collection at the top provides an at-a-glance view of overall asset status, and the grid at the bottom displays the most recently changed node information. Clicking on a platform, node type, or any cell in the grid enables drill-down to the corresponding value.
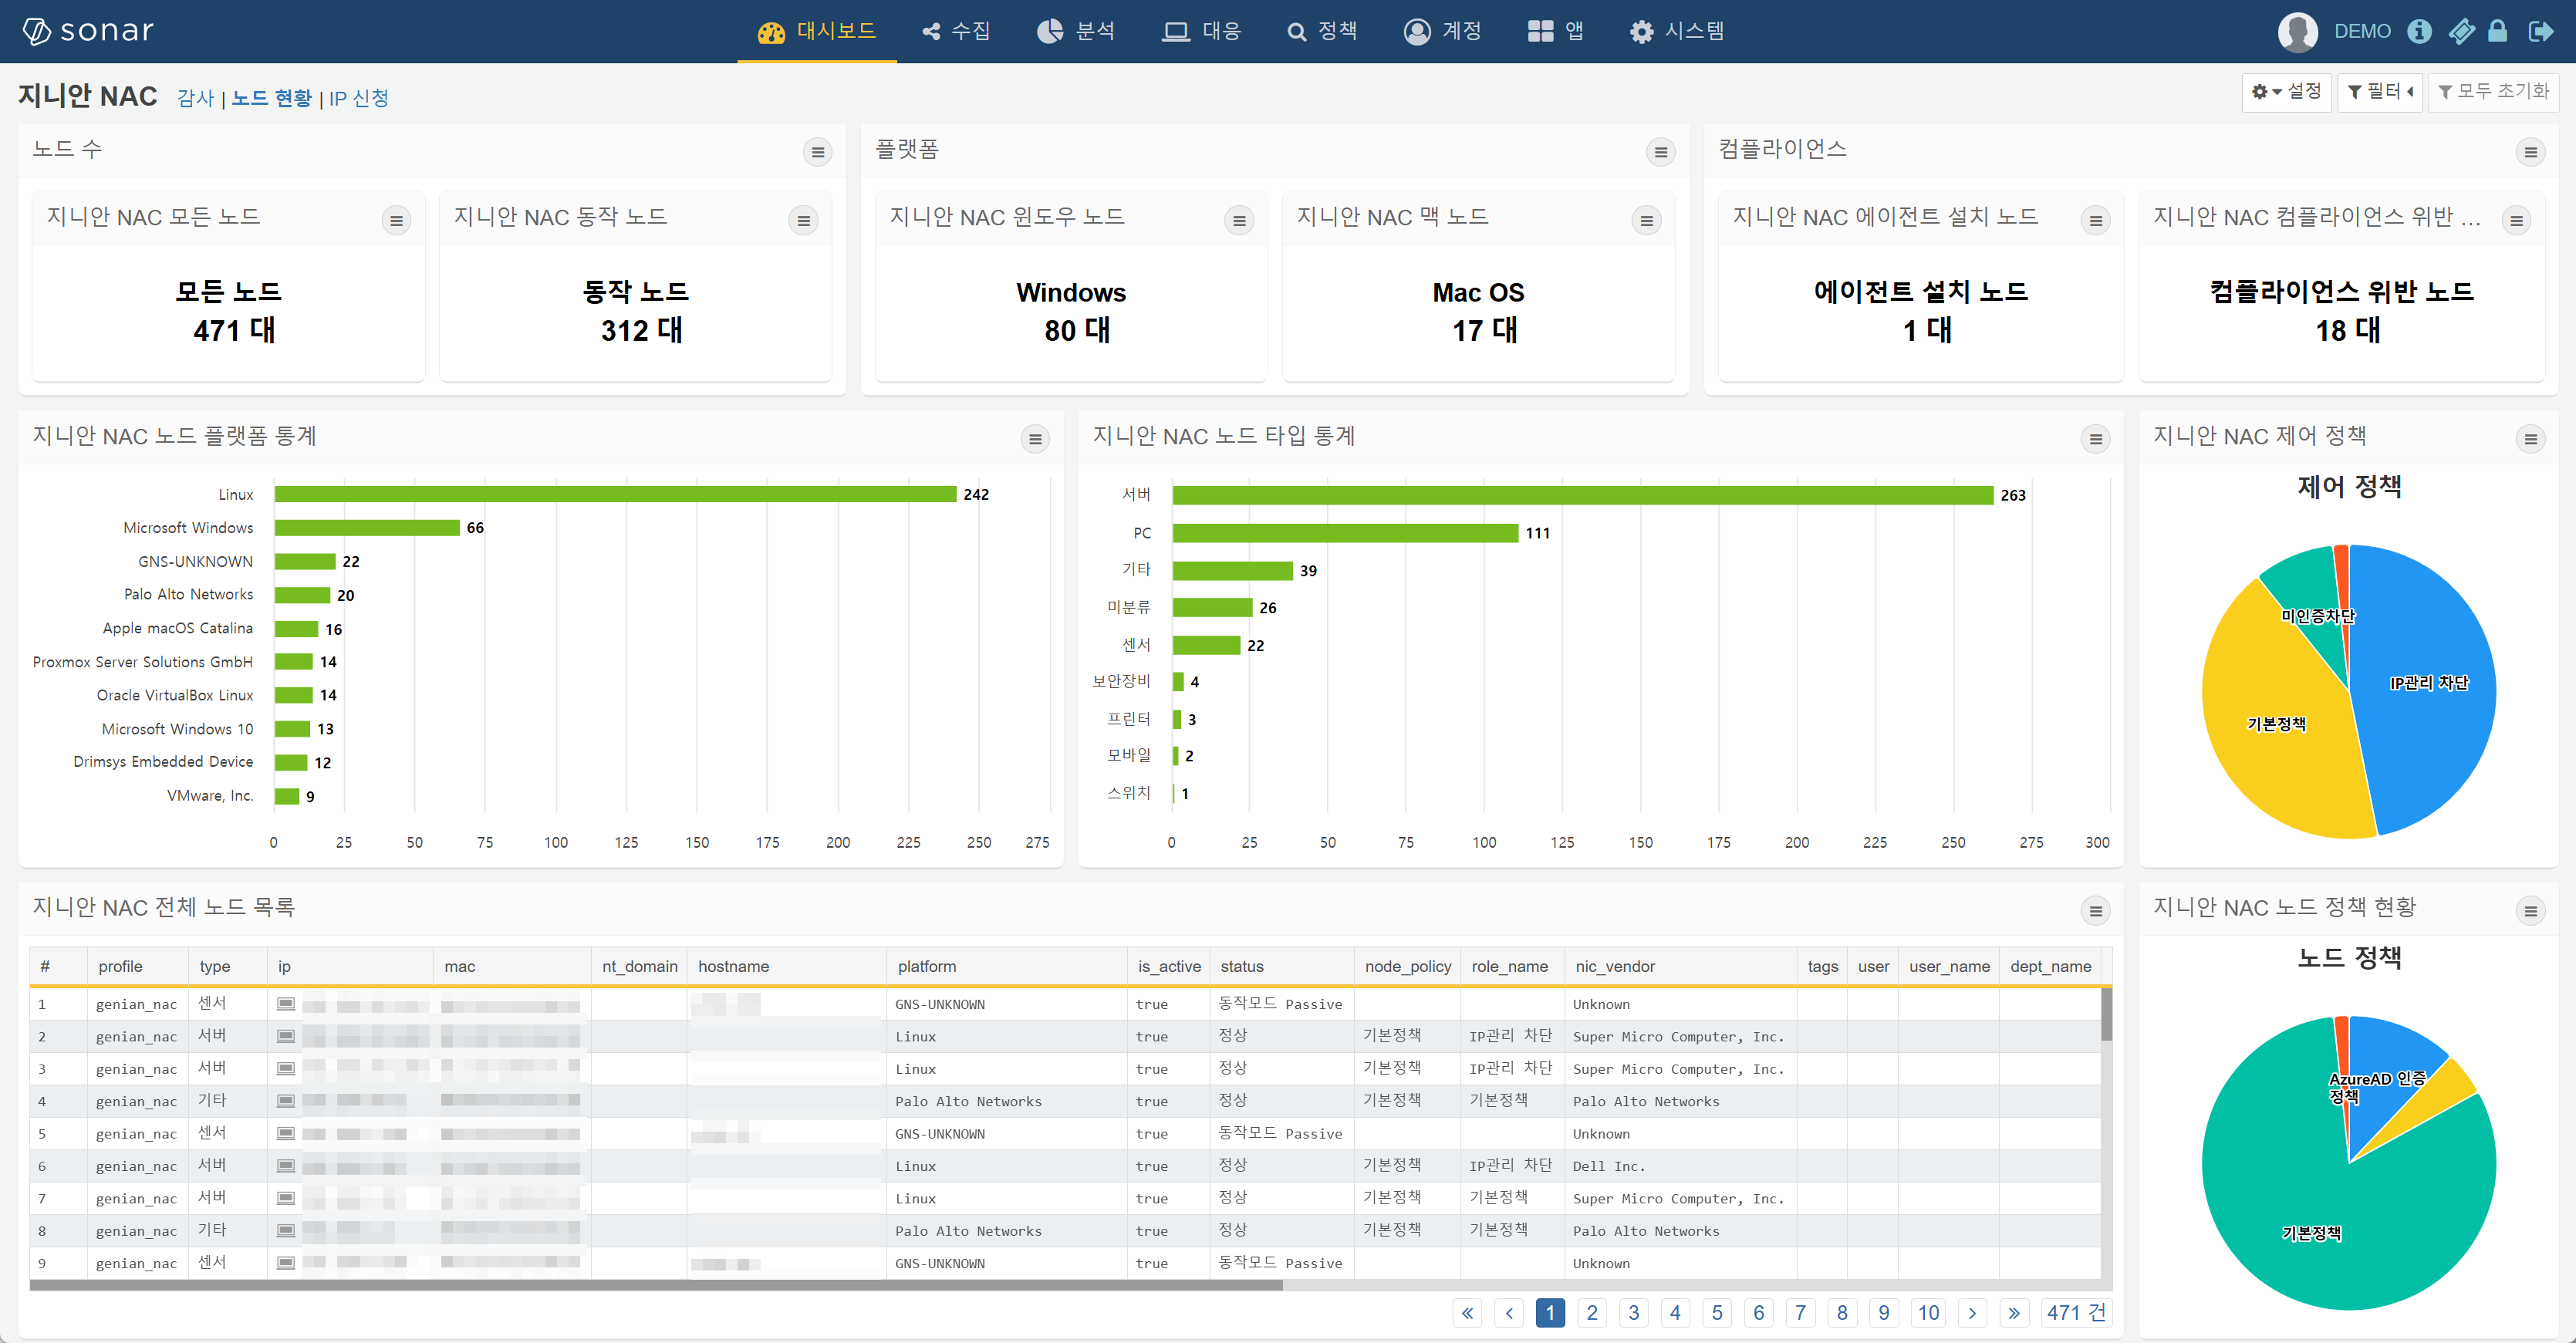
All Nodes (Alert Box)
Displays the total number of all nodes discovered on the network. This includes all nodes with an IP address, such as PCs, mobile devices, servers, and switches.
Active Nodes (Alert Box)
Windows Nodes (Alert Box)
In the Genian NAC admin console, if you go to Policy menu > Groups > Nodes > 1. Identification Tree, you can see that nodes are classified into the Microsoft Windows node group when the following condition is met:
- Under the 'Platform' field, the condition 'Detected platform contains string' is set to 'Microsoft Windows'
Apple Mac Nodes (Alert Box)
In the Genian NAC admin console, if you go to Policy menu > Groups > Nodes > 1. Identification Tree, you can see that nodes are classified into the Apple Mac OS node group when any of the following conditions are met:
- Under the 'Platform' field, the condition 'Detected platform contains string' is set to 'Apple iMac'
- Under the 'Platform' field, the condition 'Detected platform contains string' is set to 'Apple Mac'
- Under the 'Platform' field, the condition 'Detected platform contains string' is set to 'Apple macOS'
- Under the 'Platform' field, the condition 'Detected platform contains string' is set to 'Apple OS X'
Agent Installed (Alert Box)
In the Genian NAC admin console, if you go to Policy menu > Groups > Nodes > 2. Classification Tree, you can see that the Agent Installed node group classifies nodes as agent-installed when the following condition is met:
- Under the 'Agent Status' field, the 'Installation Status' condition is set to 'Installed'
Compliance Violation (Alert Box)
In the Genian NAC admin console, if you go to Policy menu > Groups > Nodes > 3. Compliance Tree, you can see that the Compliance Violation node group classifies nodes as non-compliant when any of the following conditions are met:
- Rogue AP
- Rogue AP Connection
- Windows Firewall Not Running
- Antivirus Not Installed
- Antivirus Real-time Scan Disabled
- Antivirus Update Not Satisfied
- Login Account Without Password
- Agent Not Running Node
- OS Update Status Not Satisfied
- Risk Detected Node
- Screen Saver Not Configured
Node Platform TOP 10 (Horizontal Bar)
Displays statistics by node platform, such as Microsoft Windows, Apple iMac, VirtualBox Linux, Linux, etc.
Node Type (Horizontal Bar)
Displays statistics by node type, such as PC, Server, Mobile, Security Appliance, Switch, etc.
Logs
Configured to enable quick retrieval of necessary information from audit logs. Clicking on a log level, dragging over a time range, or clicking on any cell in the audit log entries at the bottom enables drill-down to the corresponding value.
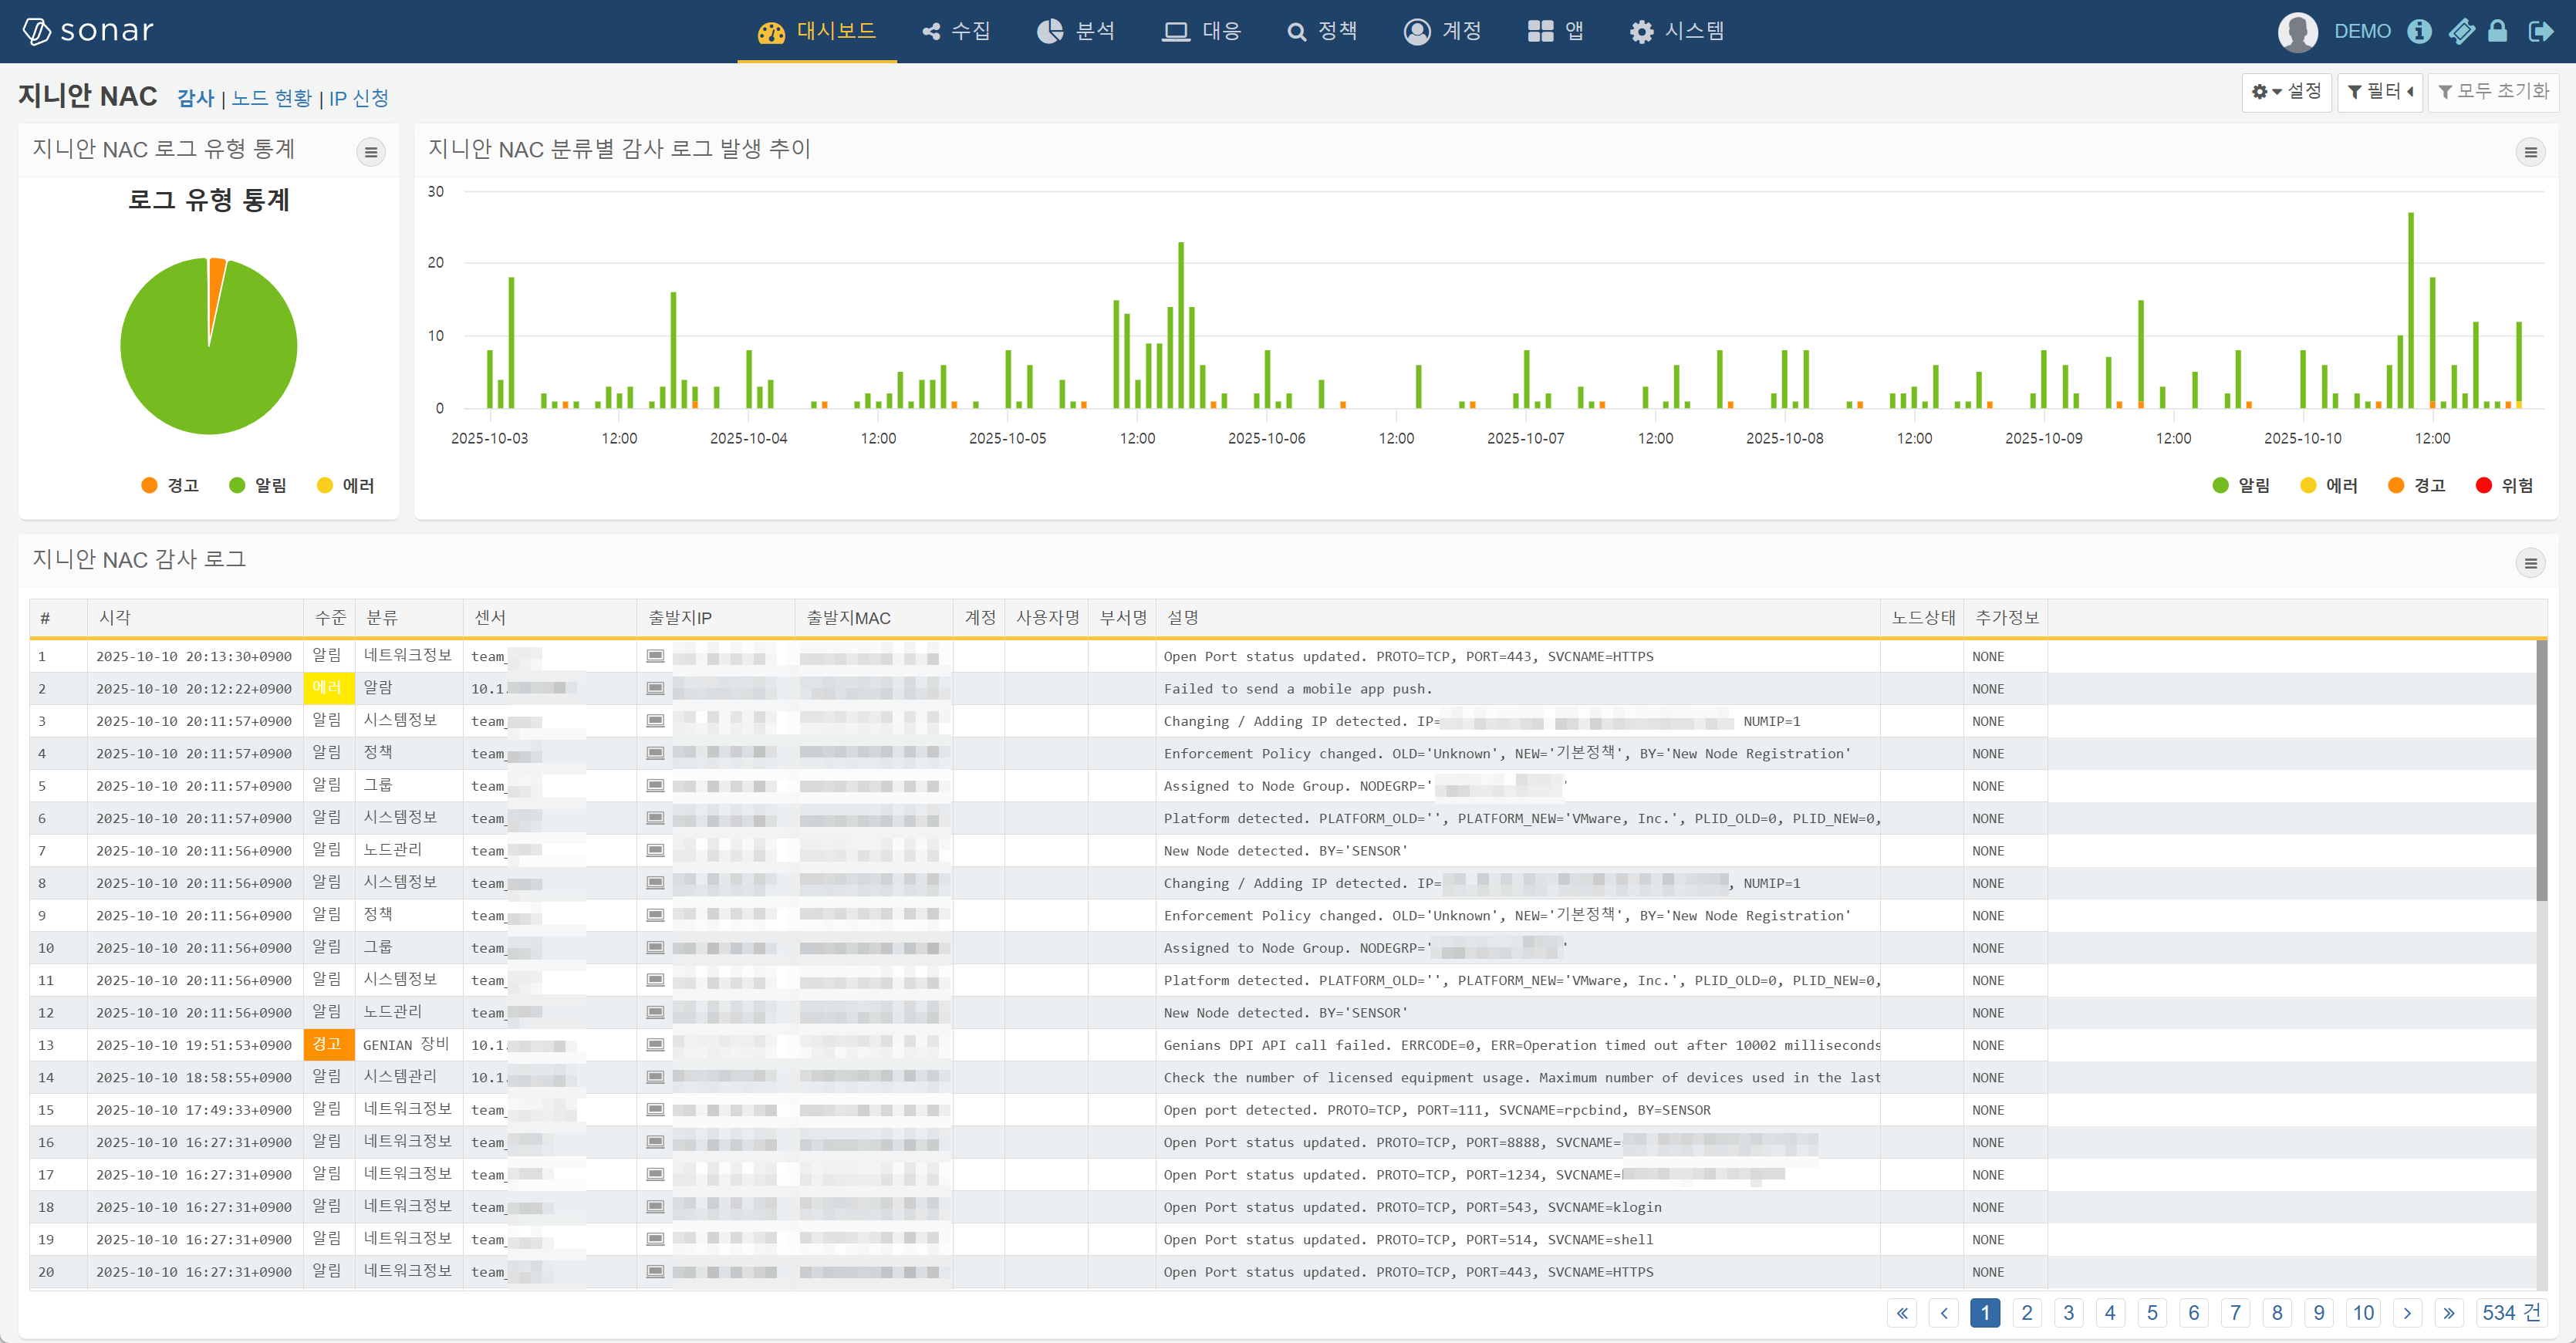
Log Level Statistics (Pie)
Displays occurrence statistics by log level for the past week of audit logs. Clicking on a pie slice drills down to the corresponding level.
Audit Log Trend (Stacked Vertical Bar)
Displays the hourly occurrence trend by log level for the past week of audit logs. Dragging along the time axis drills down to the selected time range.
Recent Audit Logs (Grid)
genian-nac-audit-logs duration=1w
| eval ip = string(ip)
| rename _time as 시각, level as 수준, category as 로그ID, source as 관리장비명, ip as IP, mac as MAC, user as 사용자ID, user_name as 사용자명, dept_name as 부서명, msg as 설명, detail as 추가정보
| fields 시각, 수준, 로그ID, 관리장비명, IP, MAC, 사용자ID, 사용자명, 부서명, 설명, 추가정보
| limit 100
Displays audit logs with the same fields as those shown in the Audit > Logs menu of the Genian NAC admin console. Clicking on any cell value enables drill-down.