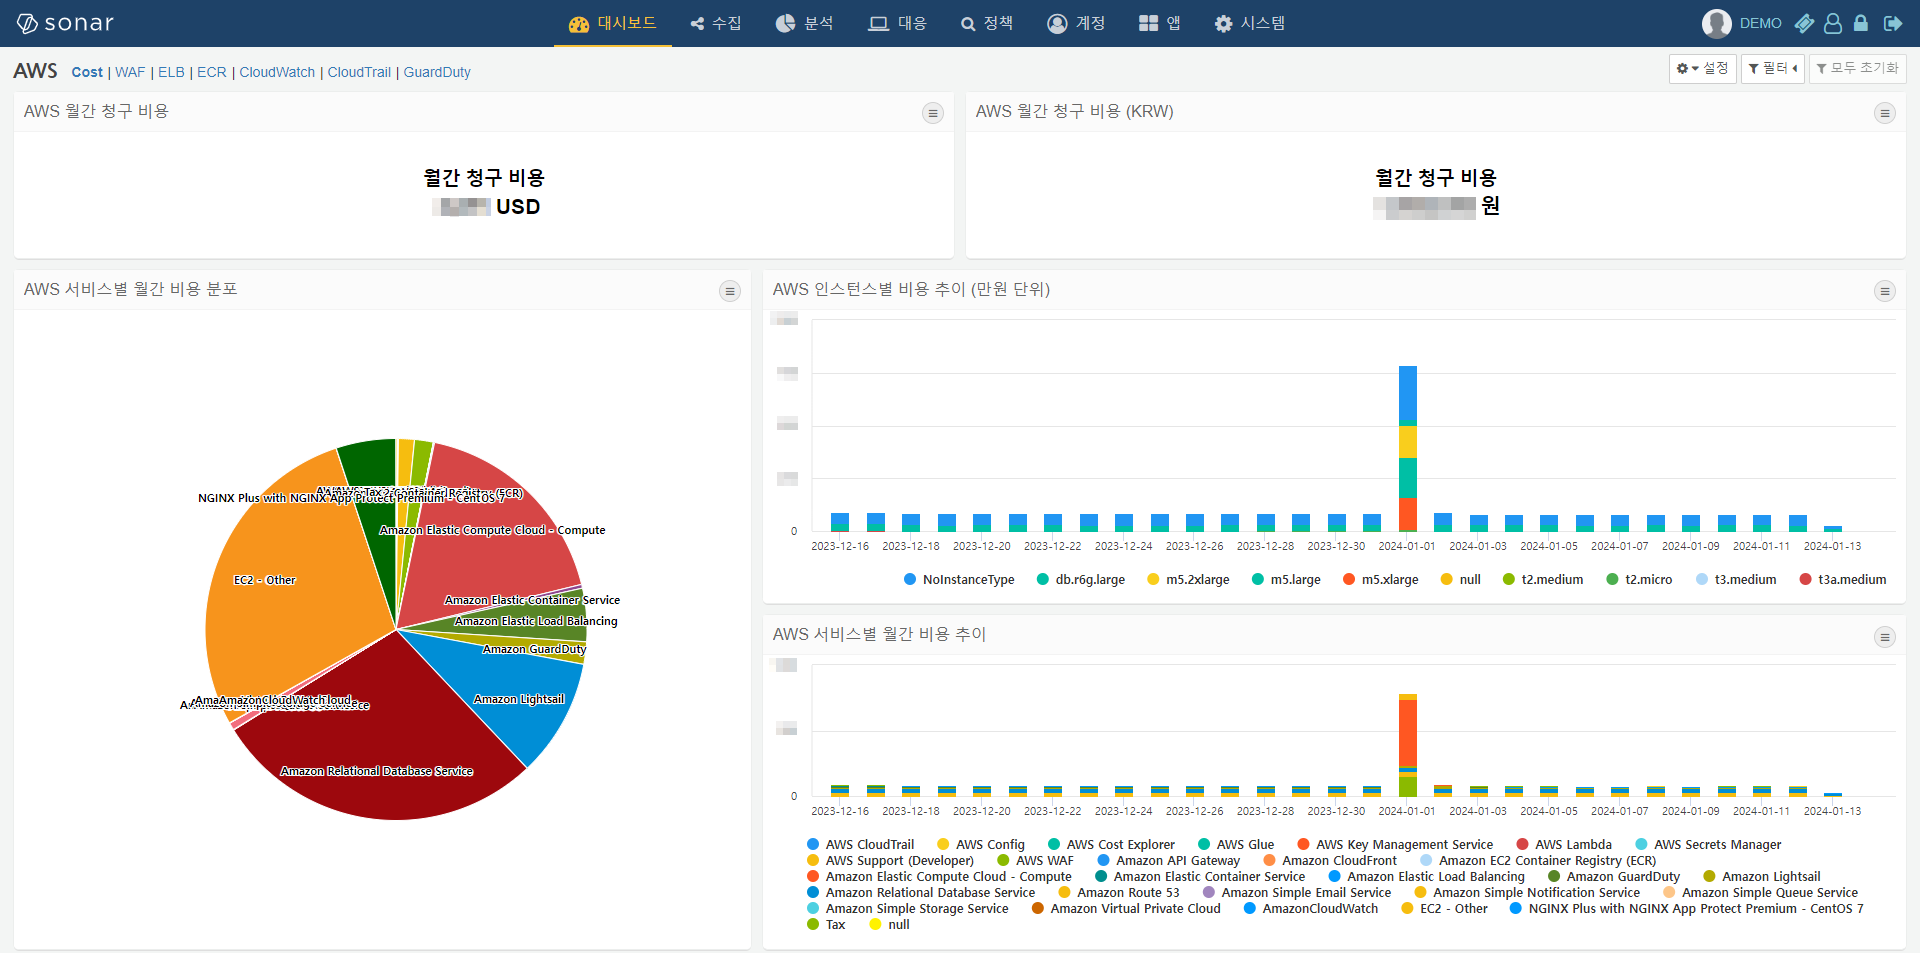
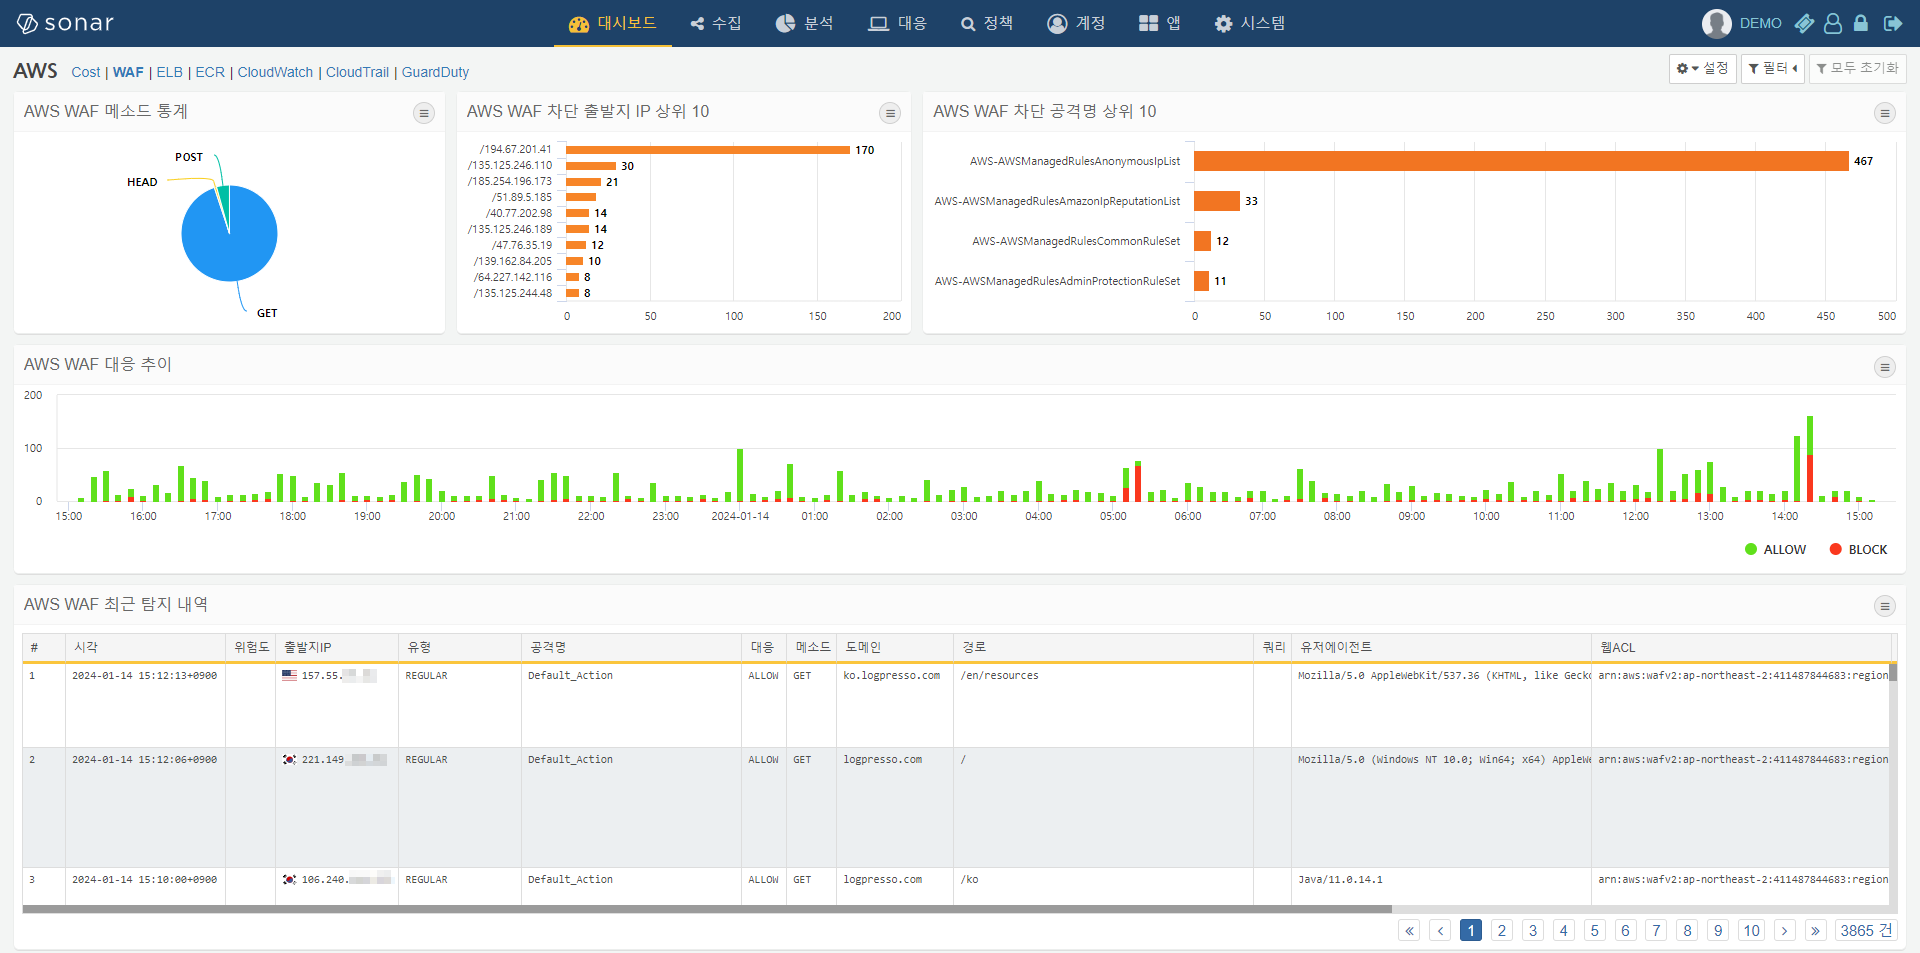
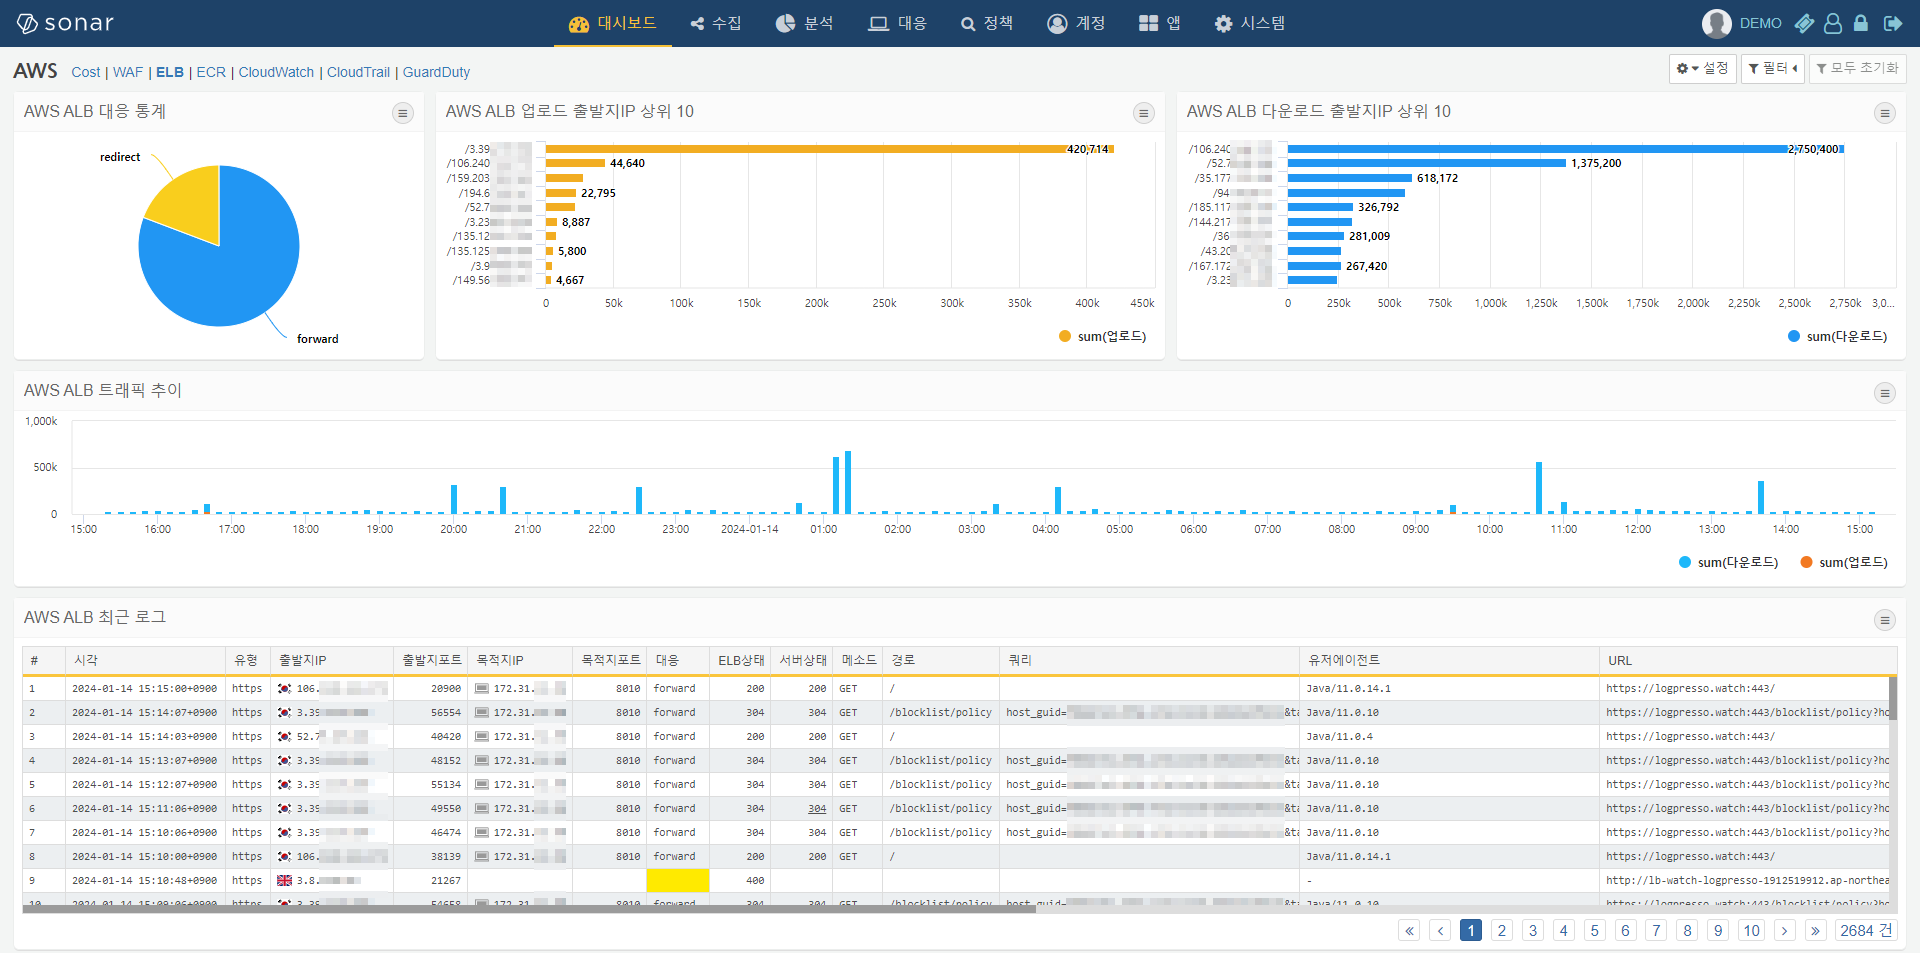
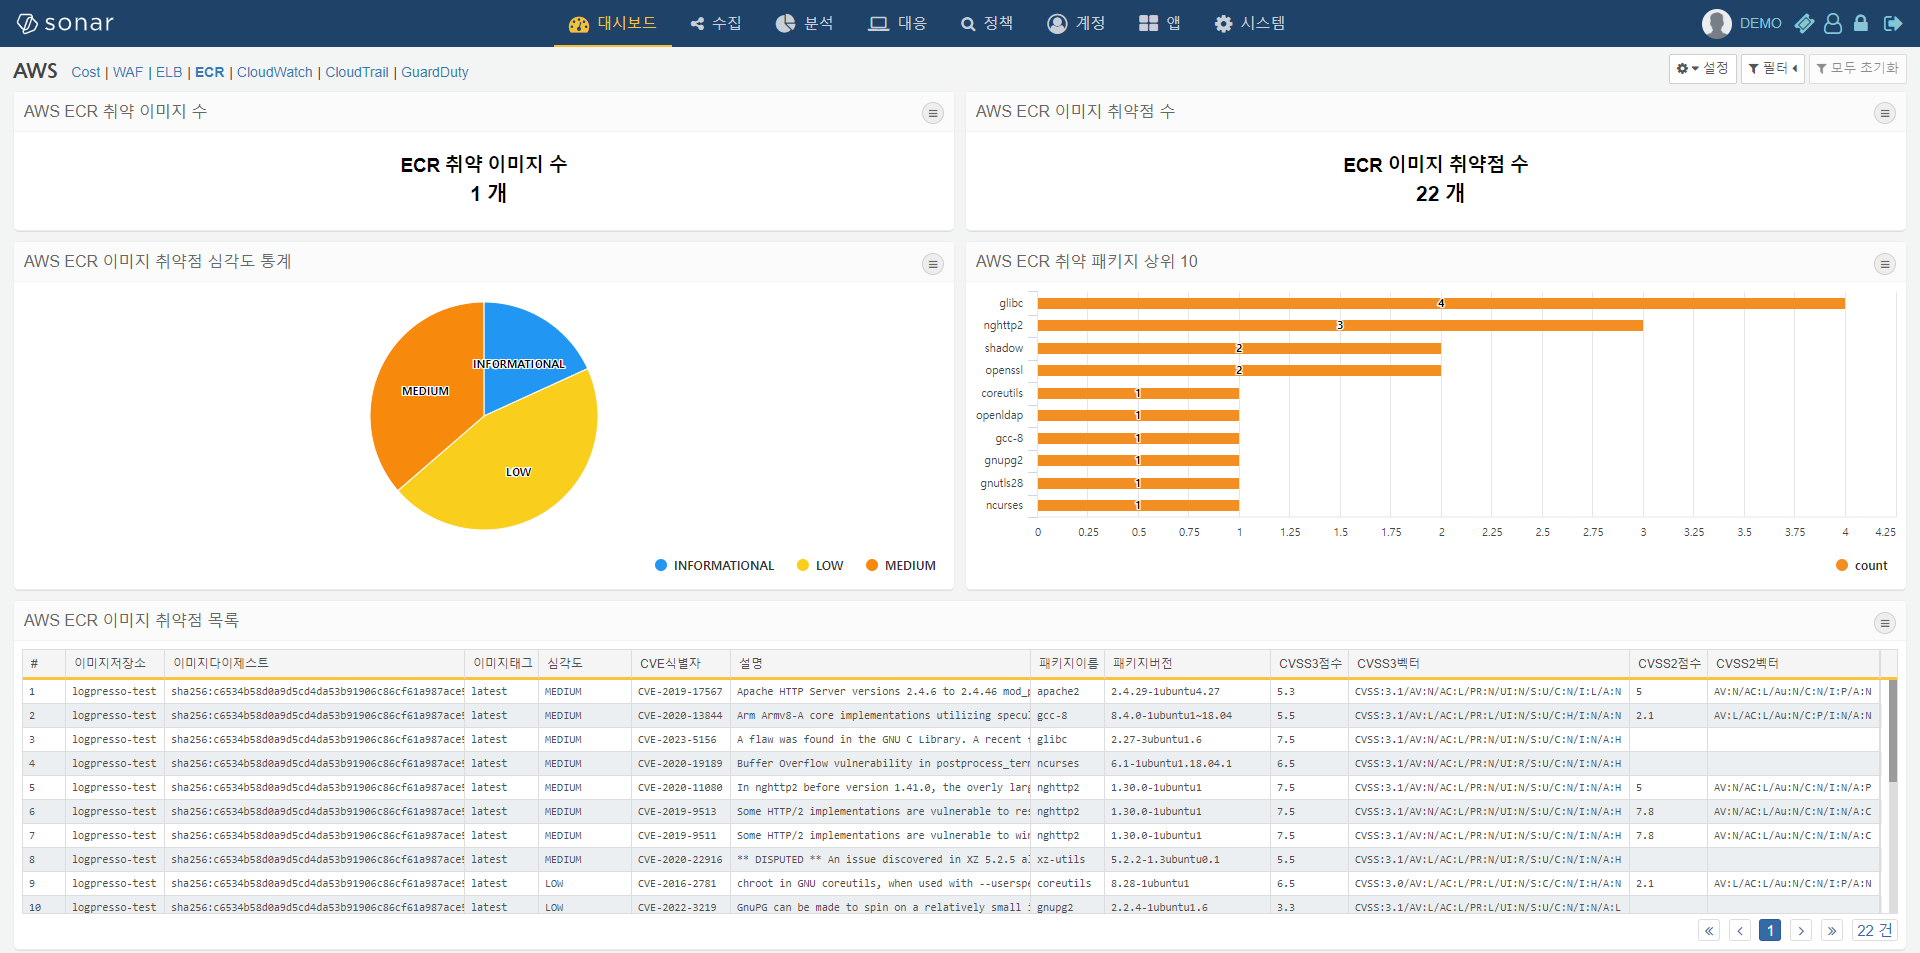
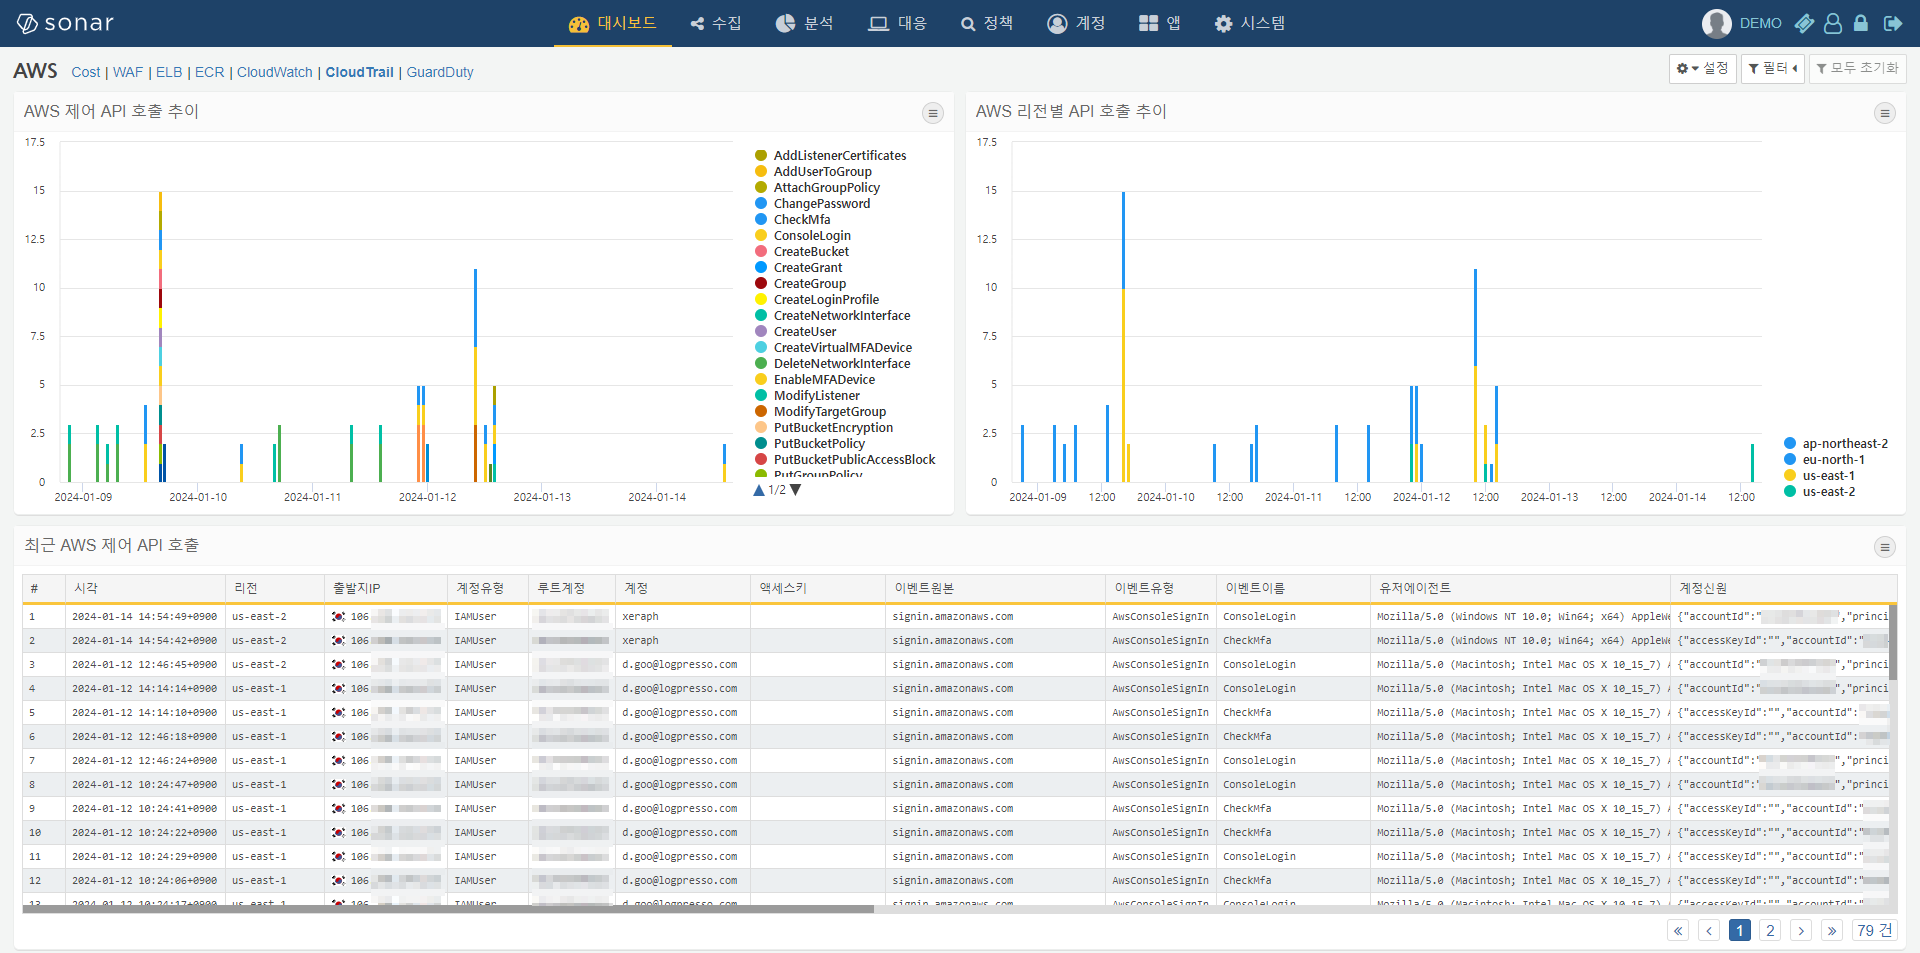
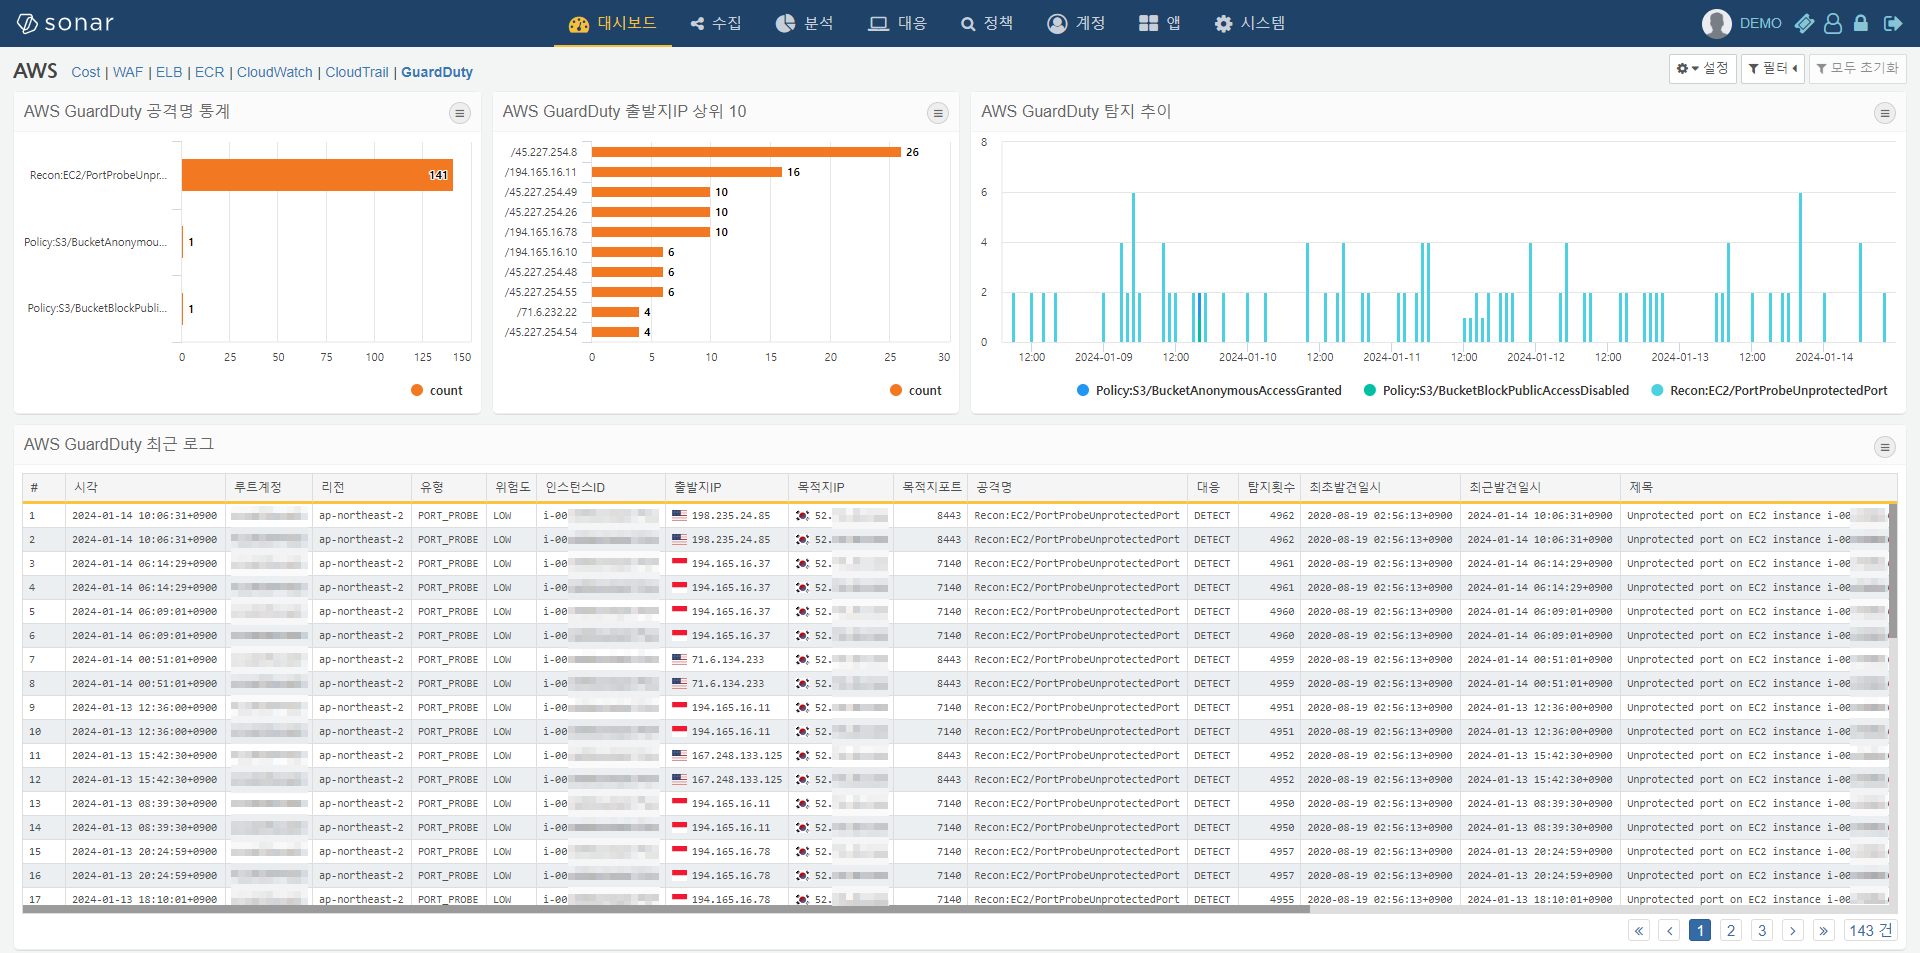
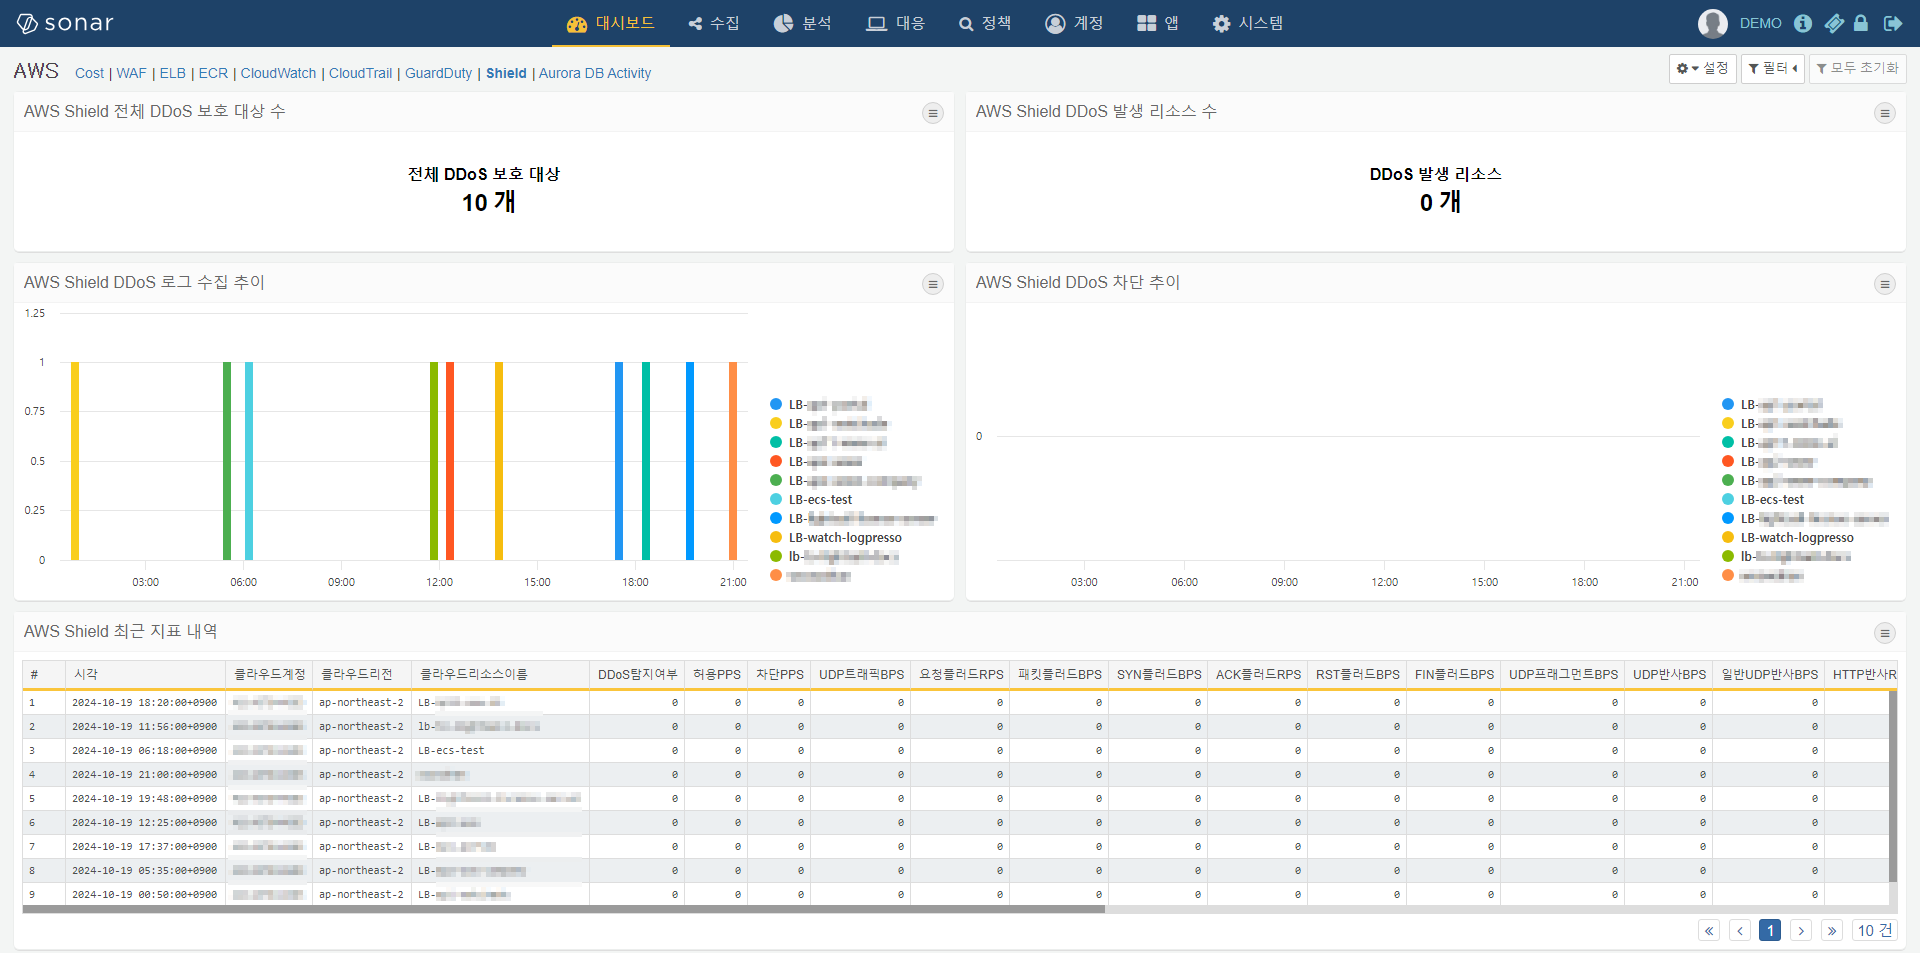
AWS

다운로드 157
업데이트 2023. 7. 30.

사용 매뉴얼

CloudTrail 대시보드

CloudTrail은 모든 AWS API 호출 내역을 S3 버킷에 기록하여 클라우드 리소스에 대한 감사를 지원합니다. CloudTrail 대시보드는 조회성 API 호출 (Describe*, List*, Get*)을 제외한 관리적 API 호출을 모니터링 할 수 있도록 지원합니다.

CloudTrail

최근 24시간 EC2 인스턴스 시작

최근 24시간의 인스턴스 시작 명령 건수를 표시합니다.

table duration=1d cloudtrail*
| search eventName == "RunInstances" and isnull(errorCode) 
| stats count

최근 24시간 EC2 인스턴스 종료

최근 24시간의 인스턴스 종료 명령 건수를 표시합니다.

table duration=1d cloudtrail*
| search eventName == "TerminateInstances" and isnull(errorCode) 
| stats count

최근 24시간 IAM 정책 변경

AWS IAM 정책이 변경되면 의도하지 않은 API를 허용하게 될 수 있습니다. IAM 정책 변경이 인가된 작업인지 모니터링하도록 합니다.

table duration=1d cloudtrail*
| search eventName == "CreatePolicyVersion" and isnull(errorCode) 
| stats count

최근 24시간 보안그룹 수정

보안그룹 정책이 변경되면 의도하지 않은 트래픽을 허용하게 될 수 있습니다. 인가된 보안그룹 변경인지, 구성에 오류는 없는지 모니터링하도록 합니다.

table duration=1d cloudtrail*
| search in(eventName, "AuthorizeSecurityGroupIngress", "RevokeSecurityGroupIngress") and isnull(errorCode) 
| stats count

AWS 구성 변경 작업 추이

조회성 API 호출을 제외하고 형상 변경과 관련된 API 호출 추이를 표시합니다. 의도하지 않은 API 호출의 세부사항을 확인하도록 합니다.

table duration=1d cloudtrail*
| search not(in(eventName, "Describe*", "List*", "Get*"))
| search sessionCredentialFromConsole == "true"
| rename eventName as event_name
| timechart span=10m count by event_name

AWS 구성 변경 내역

조회성 API 호출을 제외하고 형상 변경과 관련된 API 호출의 세부사항을 표시합니다. 콘솔 작업자, API 유형, 요청 매개변수가 의도된 작업인지 확인합니다.

table duration=1d cloudtrail*
| search not(in(eventName, "Describe*", "List*", "Get*"))
| search sessionCredentialFromConsole == "true"
| eval user = valueof(userIdentity, "userName"), access_key = valueof(userIdentity, "accessKeyId")
| rename eventID as event_id, eventName as event_name, requestParameters as req_params, errorCode as error_code
| fields _time, event_name, user, access_key, error_code, req_params
| sort limit=300 -_time

로그인 대시보드

AWS 콘솔 로그인 실패를 모니터링합니다. 실제 AWS 콘솔 사용이 인가된 국가에서 접속하는지 확인하고, 로그인 실패가 반복적으로 발생하는 경우 MFA 설정이 잘 되어있는지 확인합니다. 공격이 지속되면 IAM 정책으로 해당 IP를 차단합니다.

AWS 콘솔 로그인 대시보드

로그인 실패

로그인 실패 건수를 표시합니다. 비정상적인 로그인 실패 횟수가 나타나는지 확인합니다.

table duration=1d cloudtrail*
| search eventName == "ConsoleLogin" and isnotnull(errorMessage) 
| stats count

AWS 콘솔 로그인 국가

AWS 콘솔 로그인에 성공한 지역을 지도에 표시합니다.

table duration=1d cloudtrail*
| search eventName == "ConsoleLogin" and isnull(errorMessage)
| eval src_ip = ip(sourceIPAddress)
| lookup geoip src_ip output country 
| stats count by country

콘솔 로그인 실패 IP 주소

반복적으로 콘솔 로그인에 실패하는 상위 IP 주소를 표시합니다.

table duration=1d cloudtrail*
| search eventName == "ConsoleLogin" and isnotnull(errorMessage)
| eval src_ip = ip(sourceIPAddress)
| lookup geoip src_ip output country , asn
| stats count by src_ip, country
| eval src = concat(string(src_ip), " (", country, ")")
| sort limit=10 -count

AWS 콘솔 로그인 내역

AWS 계정이 의도된 국가 및 통신망 (ASN)에서 콘솔에 로그인하고 있는지 세부사항을 확인합니다.

table duration=1d cloudtrail*
| search eventName == "ConsoleLogin"
| eval src_ip = ip(sourceIPAddress), user = valueof(userIdentity, "userName"), user_type = valueof(userIdentity, "type")
| eval action = if(isnull(errorMessage), "PERMIT", "DENY")
| lookup geoip src_ip output country, asn
| rename errorMessage as reason, userAgent as user_agent
| fields _time, user, action, src_ip, country, asn, user_type, reason, user_agent
| sort limit=300 -_time

비용 대시보드

침해사고 혹은 사용자 실수에 의하여 고가의 클라우드 리소스가 종료되지 않은 상태로 계속 유지될 수 있습니다. 이러한 사고를 예방하기 위하여 AWS는 예산 (Budgets)과 비용 탐색기 (Cost Explorer) 서비스를 제공합니다. 로그프레소는 비용 탐색기 API를 호출하여 월간 청구 비용을 모니터링 합니다. aws-cost 확장 커맨드 매뉴얼을 참고하세요.

AWS 비용 탐색기 대시보드

월간 AWS 비용 (USD)

최근 30일 일반 비용 (Unblended cost)을 미국 달러 기준으로 표시합니다.

aws-cost days=30 unblended_cost 
| stats sum(unblended_cost) as cost
| eval cost = round(cost)

월간 청구 비용 (KRW)

최근 30일 일반 비용 (Unblended cost)을 원 기준으로 표시합니다. 달러-원 환산에 네이버 환율을 이용합니다.

aws-cost days=30 unblended_cost 
| stats sum(unblended_cost) as cost
| eval cost = round(cost)
| join type=cross [ proc usd_exchange() ]
| eval krw = cost * usd

월간 AWS 서비스 비용 비중 (USD)

최근 30일 AWS 서비스별 비용을 트리맵으로 표시합니다.

aws-cost days=30 unblended_cost by service
| stats sum(unblended_cost) as cost by service
| search cost > 0 
| sort -cost 
| eval cost = round(cost, 2)

AWS 서비스별 청구 비용 추이

최근 30일 AWS 서비스별 비용을 세로 누적 막대로 표시합니다.

aws-cost days=30 unblended_cost by service 
| eval _time = date(start, "yyyy-MM-dd")
| timechart span=1d sum(unblended_cost) as cost by service

CloudWatch 대시보드

클라우드 리소스의 전반적인 성능을 모니터링합니다. CloudWatch는 다양한 성능 지표를 제공하니 전체 목록을 살펴보려면 aws-cloudwatch-metrics 확장 커맨드 매뉴얼을 참고하세요.

CloudWatch 대시보드

가동 EC2 인스턴스

실행 중인 모든 EC2 인스턴스 수를 표시합니다.

aws-ec2-instances 
| search state_name == "running" 
| stats count

장애 EC2 인스턴스

헬스체크에 응답하지 않는 비정상 인스턴스 수를 표시합니다.

aws-ec2-instance-statuses 
| search volume_status != "ok" 
| stats count

비정상 볼륨 수

I/O 성능이 저하된 비정상 EBS 볼륨 수를 표시합니다.

aws-ec2-volume-statuses 
| search volume_status != "ok" 
| stats count

Elastic IP

엘라스틱 IP 주소 수를 표시합니다.

aws-ec2-addresses 
| stats count

EC2 인스턴스 유형

EC2 인스턴스 유형별 수를 표시합니다. 의도하지 않은 인스턴스 유형이 실행되는지 확인할 수 있습니다.

aws-ec2-instances 
| search state_name == "running" 
| stats count by instance_type 
| sort -count

RDS SELECT 처리시간 분포

SELECT 쿼리 소요 시간이 오래 걸리는 상위 5개 인스턴스에 대하여 SELECT 처리 시간 4분위 수를 상자그림으로 표시합니다.

aws-cloudwatch-stats duration=1h span=1m metric="SelectLatency" 
| join label [ 
    aws-cloudwatch-stats duration=1h span=1m metric="SelectLatency" 
    | stats max(value) as value by label 
    | sort limit=5 -value 
    | fields label ]
| boxplot value by label

CPU 사용율 추이

CPU 사용율 부하가 높은 상위 15개 인스턴스에 대하여 CPU 평균 사용율 추이를 10분 단위로 표시합니다.

aws-cloudwatch-stats duration=1d span=10m metric="CPUUtilization"
| join label [ 
    aws-cloudwatch-stats duration=1d span=10m metric="CPUUtilization"
    | stats avg(value) as value by label
    | sort limit=15 -value 
    | fields label ]
| eval instance_id = strjoin("", foreach(if(valueof(_1, "name") == "InstanceId", valueof(_1, "value"), ""), dimensions))
| join type=left instance_id [
    aws-ec2-instances 
    | eval instance_name = strjoin("", foreach(if(valueof(_1, "key") == "Name", valueof(_1, "value"), ""), tags))
    | eval instance_name = if(len(instance_name) == 0, label, instance_name) 
    | fields instance_id, instance_name ]
| eval instance_name = if(len(instance_name) == 0, label, instance_name)
| timechart span=10m avg(value) by instance_name

ELB 상태 대시보드

AWS ELB 상태 대시보드

HTTP 메소드 통계

메소드 유형별 호출 수를 표시합니다.

table duration=1d aws-elb_*
| search isnotnull(method)
| stats count by method 
| sort -count

서버별 처리시간 분포

서버가 요청을 응답하는데 소요된 시간의 분포를 사분위수 상자 그림으로 표시합니다. 75% 분위를 기준으로 대부분의 HTTP 요청을 수행하는데 어느 정도의 시간이 걸리는지 파악할 수 있습니다.

table duration=1d aws-elb_*
| search target_processing_time > 0 
| boxplot target_processing_time by target_ip

서버별 응답 시간 분포

서버가 요청을 응답하는데 소요된 시간의 분포를 산포도로 표시합니다. 일반적으로 아무리 지연되더라도 1초 (1000ms) 이내의 응답시간을 보여야 합니다.

table duration=1d aws-elb_*
| search isnotnull(target_ip)
| sort limit=300 -target_processing_time by target_ip
| timechart span=10m max(target_processing_time) by target_ip

상위 업로드 클라이언트

클라이언트별 업로드 트래픽 상위 IP 주소를 표시합니다. 비정상적 업로드 트래픽은 봇의 지속적인 활동을 의미할 수 있습니다.

table duration=1d aws-elb_*
| stats sum(received_bytes) as bytes by client_ip 
| sort limit=10 -bytes

상위 다운로드 클라이언트

클라이언트별 다운로드 트래픽 상위 IP 주소를 표시합니다. 비정상적 다운로드 트래픽은 정보 유출 혹은 서비스 거부 공격을 의미할 수 있습니다.

table duration=1d aws-elb_*
| stats sum(sent_bytes) as bytes by client_ip 
| sort limit=10 -bytes

서버별 업로드 트래픽 (10분 단위)

서버별 업로드 트래픽(클라이언트에서 서버로 요청 전송) 추이를 모니터링합니다.

table duration=1d aws-elb_*
| timechart span=10m sum(received_bytes) by target_ip

서버별 다운로드 트래픽 (10분 단위)

서버별 다운로드 트래픽(서버에서 클라이언트로 응답 전송) 추이를 모니터링합니다.

table duration=1d aws-elb_*
| timechart span=10m sum(sent_bytes) by target_ip

ELB 오류 대시보드

HTTP 오류 발생 현황을 확인하고 공격을 지속하는 위협원은 보안그룹이나 웹 방화벽에서 차단 조치합니다.

AWS ELB 오류 대시보드

상위 페이지 오류 유발 IP

HTTP 오류를 유발하는 상위 IP와 URL 유형 통계를 표시합니다. 대부분의 경우 여러 경로를 통해 존재하지 않는 페이지를 호출하는 클라이언트는 공격자입니다.

table duration=1d aws-elb_*
| search elb_status_code >= 400
| stats dc(url) as count by client_ip 
| sort limit=20 -count

ELB 상위 페이지 오류 20

HTTP 오류를 유발하는 상위 IP와 URL 목록을 표시합니다. 대부분의 경우 여러 경로를 통해 존재하지 않는 페이지를 호출하는 클라이언트는 공격자입니다.

table duration=1d aws-elb_*
| search elb_status_code >= 400
| stats  dc(url) as count, values(url) as url by client_ip 
| eval url = strjoin("\n", url)
| sort limit=20 -count
| lookup geoip client_ip output country, asn
| order client_ip, country, asn, count, url

호스트 헤더 통계

ELB 접속 시 전송된 Host 헤더 통계를 표시합니다. 웹서비스와 무관한 Host 헤더를 통해 구성 오류나 웹 공격을 식별할 수 있습니다.

table duration=1d aws-elb_*
| stats count by host 
| sort -count

ELB 접속 내역

ELB 접속 로그 세부사항을 표시합니다.

table duration=1d aws-elb_*
| search isnull(domain_name)
| fields _time, client_ip, actions_executed, elb_status_code, target_status_code, domain_name, host, method, url, user_agent
| limit 300