

Install Guide
Installing the Splunk App
Since the Superna Data Security Edition product supports integration via the Splunk HTTP Event Collector method, both Logpresso Cloud and Logpresso Sonar can receive the same HTTP data through the Splunk app. Therefore, to configure the Superna ZT log collector, you must first install the Splunk app. Visit the following URL and install Splunk app version 1.3.2411.3 or later.
https://logpresso.store/ko/apps/splunk
Installing the Superna Data Security Edition App
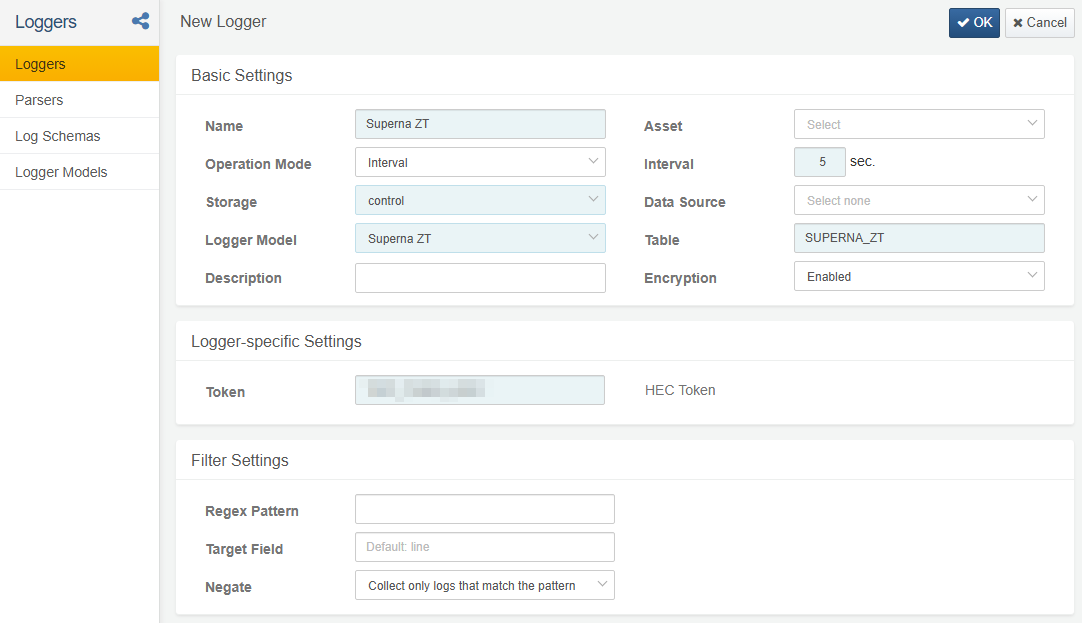
Install the Superna Data Security Edition app. Once installed successfully, you will see the Superna ZT logger model, which references the Splunk HEC logger type, as shown below:
Configuring Logpresso Logger
Refer to this document to add a collector. The default dashboards and datasets refer to tables starting with SUPERNA_ZT.
Required fields when configuring the collector:
- Name: Enter a unique name to identify the collector
- Interval: 5 seconds
- Storage: Select the appropriate node according to the Logpresso platform configuration
- Logger Model: Select Superna ZT
- Table: Enter the table name starting with SUPERNA_ZT
- Token: Use the token value configured for Superna ZT Alarm transmission in the previous step
Superna Defender Zero Trust Configuration
Refer to the Logpresso Sonar SIEM Superna Zero Trust Alarm document to configure your Logpresso Cloud or Logpresso Sonar instance to receive webhooks.
Superna Integration Procedure
The following procedure describes how to configure the Eyeglass virtual machine and Logpresso to integrate security events generated by Superna Defender Zero Trust into Logpresso Cloud or Logpresso Sonar.
1. Prerequisites
- Install the Data Security Edition subscription product
- Eyeglass OS appliance version 15.5 or later (verify with
cat /etc/os-release) - Zero Trust API license key
- Obtain the HEC token value of the Logpresso collector
2. Set up Python Runtime Environment on the Eyeglass VM
ssh admin@<VM-IP>
sudo -s
mkdir -p /opt/superna/cgi-bin
chown -R sca:users /opt/superna/cgi-bin
chmod -R u+rwX,g+rwX /opt/superna/cgi-bin

# Switch to SCA user
sudo -u sca -s
cd /opt/superna/cgi-bin

# Create Python virtual environment and install packages
python3 -m venv venv-logpresso
source venv-sonar/bin/activate
pip install flask boto3 requests logging
deactivate

# Create integration script files
touch logpresso.py logpresso.sh
chmod +x logpresso.py logpresso.sh
3. Create Execution Script
Create /opt/superna/cgi-bin/logpresso.sh with the following content:
#!/bin/bash
export PATH="/opt/.pyenv/bin:$PATH"
source /opt/superna/cgi-bin/venv-logpresso/bin/activate
exec python /opt/superna/cgi-bin/logpresso.py
4. Register as a systemd Service
Create /etc/systemd/system/logpresso.service:
[Unit]
Description=Webhook listener for Zero Trust API translations and integrations
After=network.target

[Service]
Type=simple
User=sca
Group=users
WorkingDirectory=/opt/superna/cgi-bin
ExecStart=/bin/bash /opt/superna/cgi-bin/logpresso.sh
Restart=always
RestartSec=5

[Install]
WantedBy=multi-user.target
5. Modify Python Code
-
In the provided template, replace the following with the token value and Logpresso HEC URL:
-
Save this in
/opt/superna/cgi-bin/logpresso.py
7. Start and Check Service Status
It should show "active and running".
8. Configure Defender Zero Trust Webhook
- In the Ransomware Defender Zero Trust tab, create a Webhook
- URL:
http://localhost:5000/webhook - Header:
Content-Type: application/json - Recommended: Only configure Critical/Major events and lockout-related webhooks
9. Integration Test
- Run the provided
curlcommand from the Eyeglass VM - In the SSH terminal, confirm the
"done sending event to logpresso..."message and HTTP 200 response - In Logpresso, run
table SUPERNA_ZTto check if events are being collected
10. Operation
- Monitor logs in real-time with
journalctl -f -u logpresso - A successful request should return
successCount 1 - Build dashboards and triggers as needed for automated response