

사용 매뉴얼
대시보드
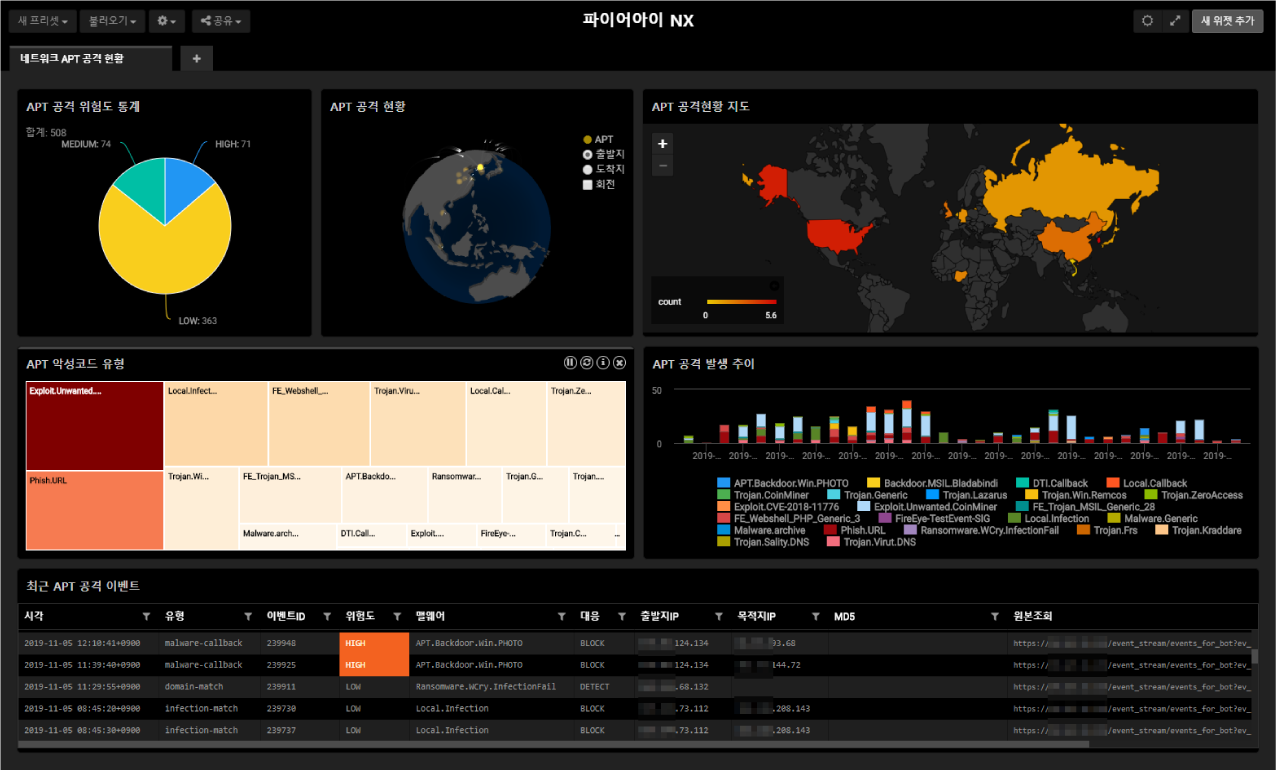
APT 공격 위험도 통계 (파이)
table duration=1mon nx
| stats count by risk
HIGH, MEDIUM, LOW 위험도별 통계를 표시하고, 차트 클릭 시 드릴다운 가능하도록 구성합니다.
APT 공격 현황 (3D 글로브)
table duration=1mon nx
| fields src_ip, dst_ip | search isnotnull(src_ip) and isnotnull(dst_ip)
| lookup geoip src_ip output country as src_country, latitude as src_latitude, longitude as src_longitude
| lookup geoip dst_ip output country as dst_country, latitude as dst_latitude, longitude as dst_longitude
| eval src_country = nvl(src_country, "--"), dst_country = nvl(dst_country, "--")
| search src_country != "--" or dst_country != "--"
| eval country = if(src_country == "--", dst_country, src_country)
| eval latitude = if(src_country == "--", dst_latitude, src_latitude)
| eval longitude = if(src_country == "--", dst_longitude, src_longitude)
| stats count by country, latitude, longitude
| eval c_latitude = 37.511199951171875, c_longitude = 126.9740982055664, c_country = "KR", category = "APT"
로그 유형에 따라 공격자 IP가 출발지IP이거나 목적지IP 일 수 있습니다. 가령 웹쉘 업로드 시도의 경우 출발지IP가 공격자IP에 해당하지만, 맬웨어 다운로드의 경우 목적지IP가 유포지 서버에 해당합니다. 따라서 국가 코드 추출 후 사설망 대역으로 확인되면, 사설망을 배제하고 공격자 위치를 식별하여 글로브 위경도에 매핑합니다.
APT 공격현황 지도 (세계지도)
table duration=1mon nx
| fields src_ip, dst_ip | search isnotnull(src_ip) and isnotnull(dst_ip)
| lookup geoip src_ip output country as src_country
| lookup geoip dst_ip output country as dst_country
| eval src_country = nvl(src_country, "--"), dst_country = nvl(dst_country, "--")
| search src_country != "--" or dst_country != "--"
| eval country = if(src_country == "--", dst_country, src_country)
| stats count by country | eval count=log(count) | sort -count
3D 글로브와 동일한 방식으로 출발지IP와 목적지IP에서 ISO 2자리 국가코드를 산출하여 세계지도에 매핑합니다. 세계지도의 수치를 색상으로 변환할 때, 숫자의 차이가 너무 크면 색상이 양 극단으로 벌어지므로 log(count)를 통해 적절한 색상 범위로 다시 변환합니다.
APT 악성코드 유형 (트리맵)
table duration=1mon nx
| search isnotnull(signature)
| stats count by signature
| sort -count
| eval log = log(if(count == 1, 1.1, count))
건수 그대로 트리맵에 매핑하면 가장 큰 값이 대부분의 면적을 차지하기 때문에, log 함수를 이용하여 크기를 보정합니다. 이 때 log(1)=0 이기 때문에 표시되지 않으므로 1.1 정도로 보정해서 표시합니다.
APT 공격 발생 추이 (누적 세로 막대)
시계열로 맬웨어나 APT 공격 유형별 발생 추이를 표시합니다.
최근 APT 공격 이벤트 (그리드)
table duration=1mon nx
| eval src_ip = string(src_ip), dst_ip = string(dst_ip)
| rename _time as 시각, policy as 유형, event_id as 이벤트ID, risk as 위험도, signature as 맬웨어, action as 대응, src_ip as 출발지IP, dst_ip as 목적지IP, md5 as MD5, alert_url as 원본조회
| fields 시각, 유형, 이벤트ID, 위험도, 맬웨어, 대응, 출발지IP, 목적지IP, MD5, 원본조회
| limit 300
그리드 설정 시 위험도가 HIGH 값인 항목은 배경색을 강조하여 쉽게 눈에 띄이도록 구성합니다.